Comfort Maps Thesis Presentation
May
13th,
2020
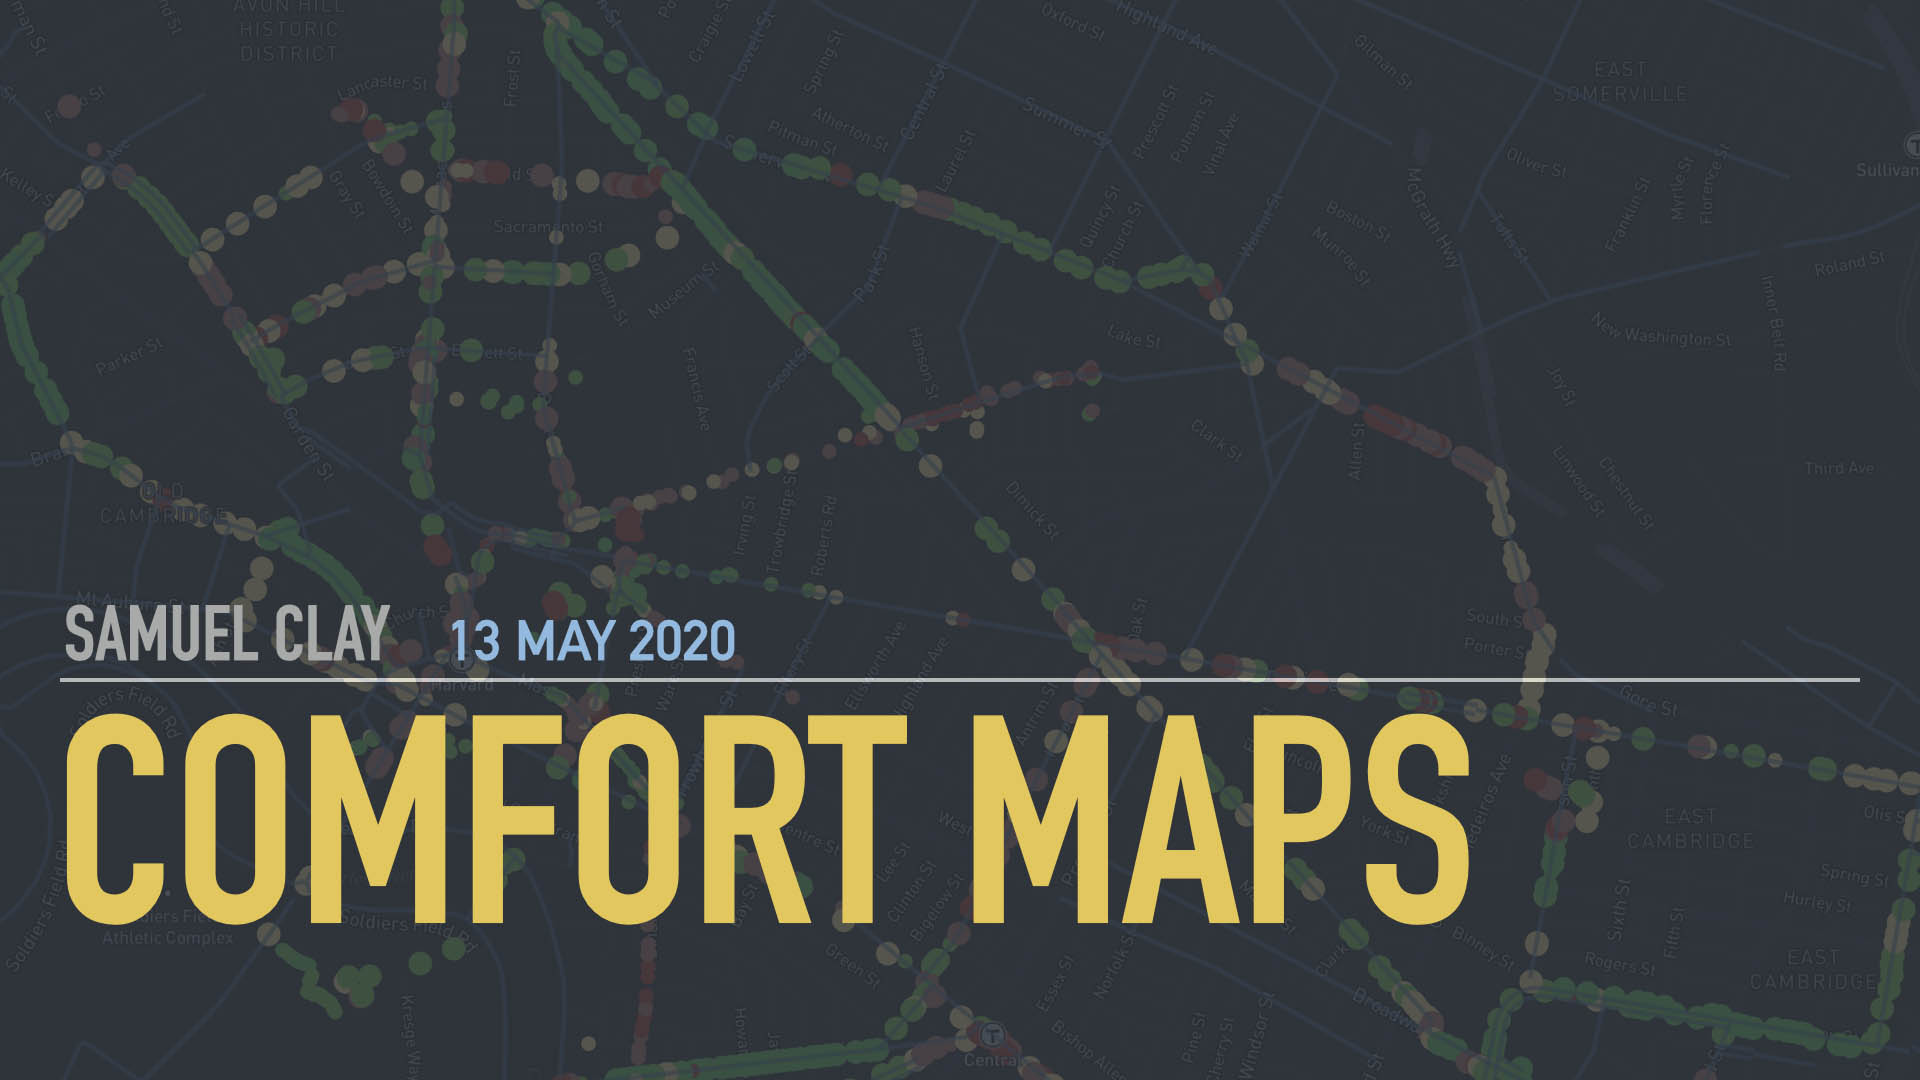
- Presenting Comfort Maps, part of Harvard’s Master in Design Engineering program
- Available today: comfortmaps.com
- We can decide what our new normal looks like
- Resilience is now a necessary goal for cities
- Cities have climate goals, clean air goals, energy usage requirements
- Transportation is 30% of emissions in U.S., largest share of all sectors
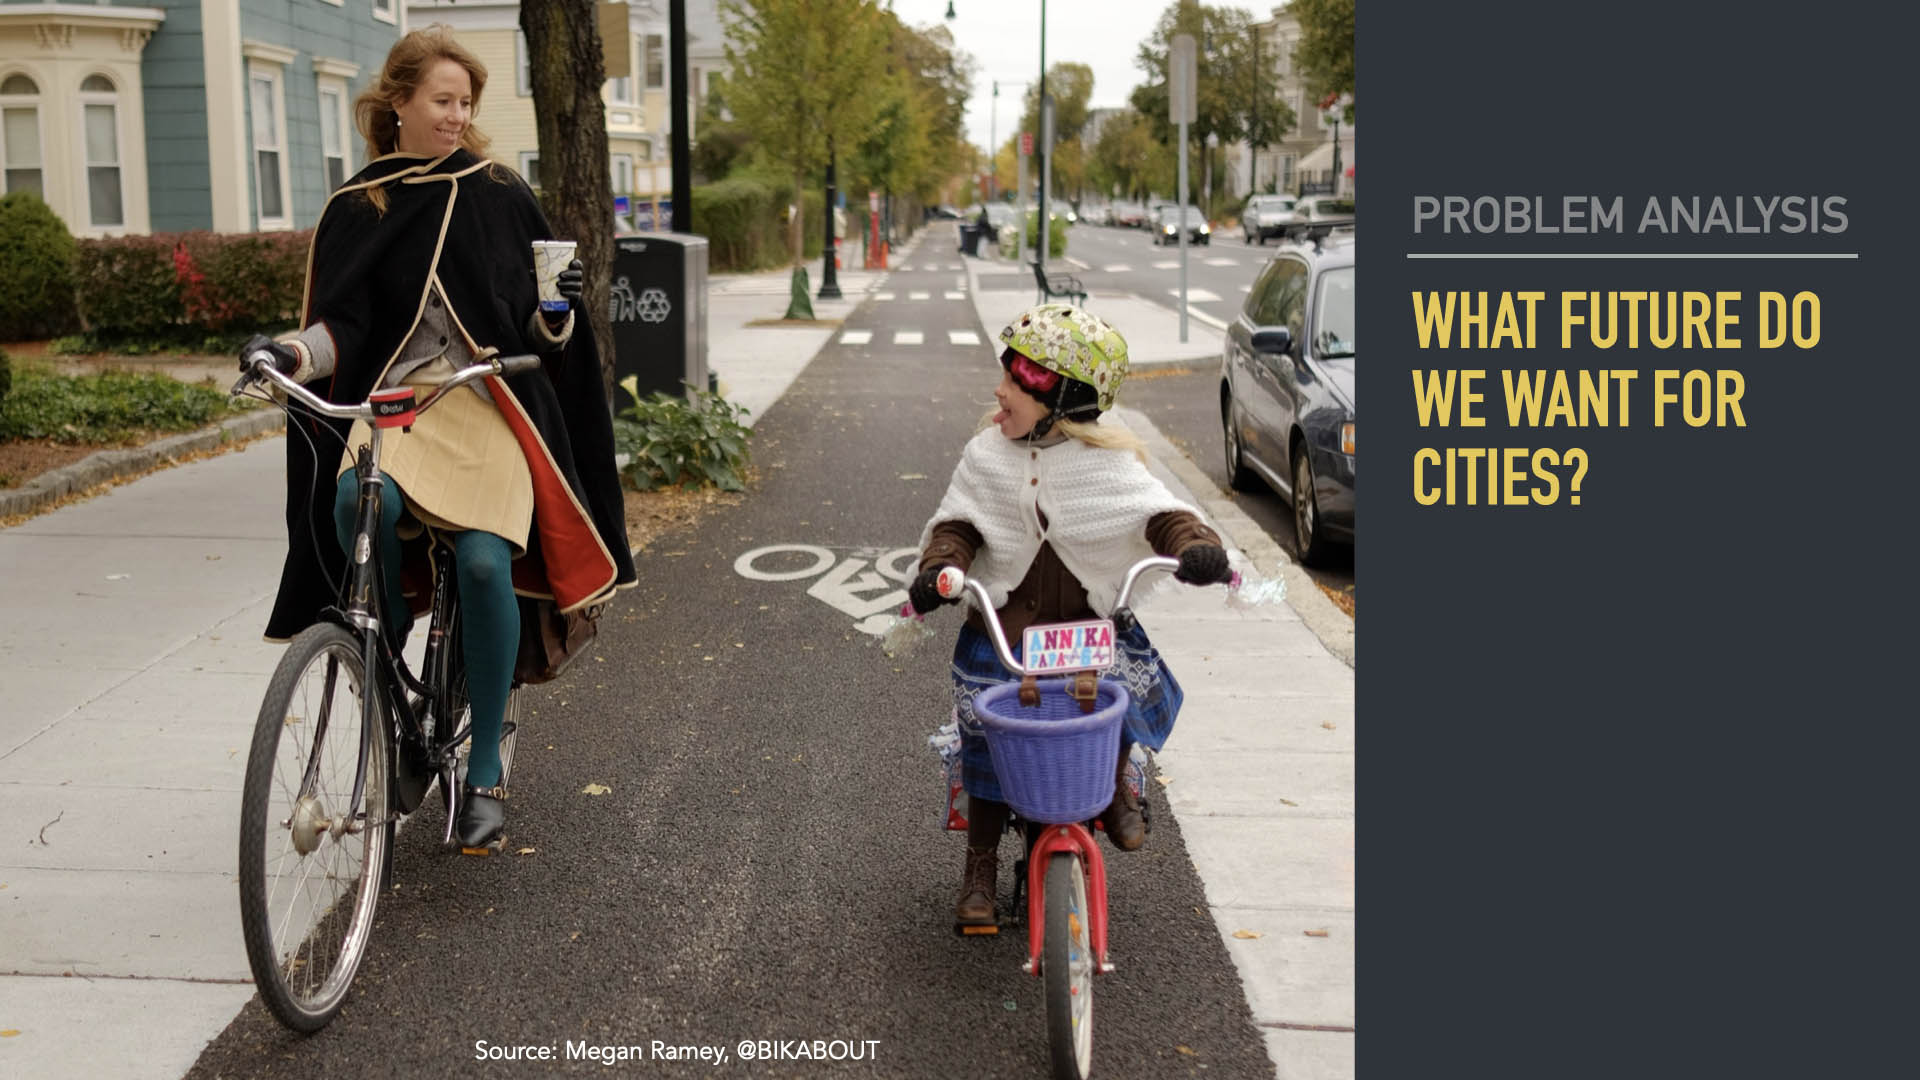
- The 20th C. has asked how many cars can we move down the street
- The 21st C. should ask how many people can we move down the street
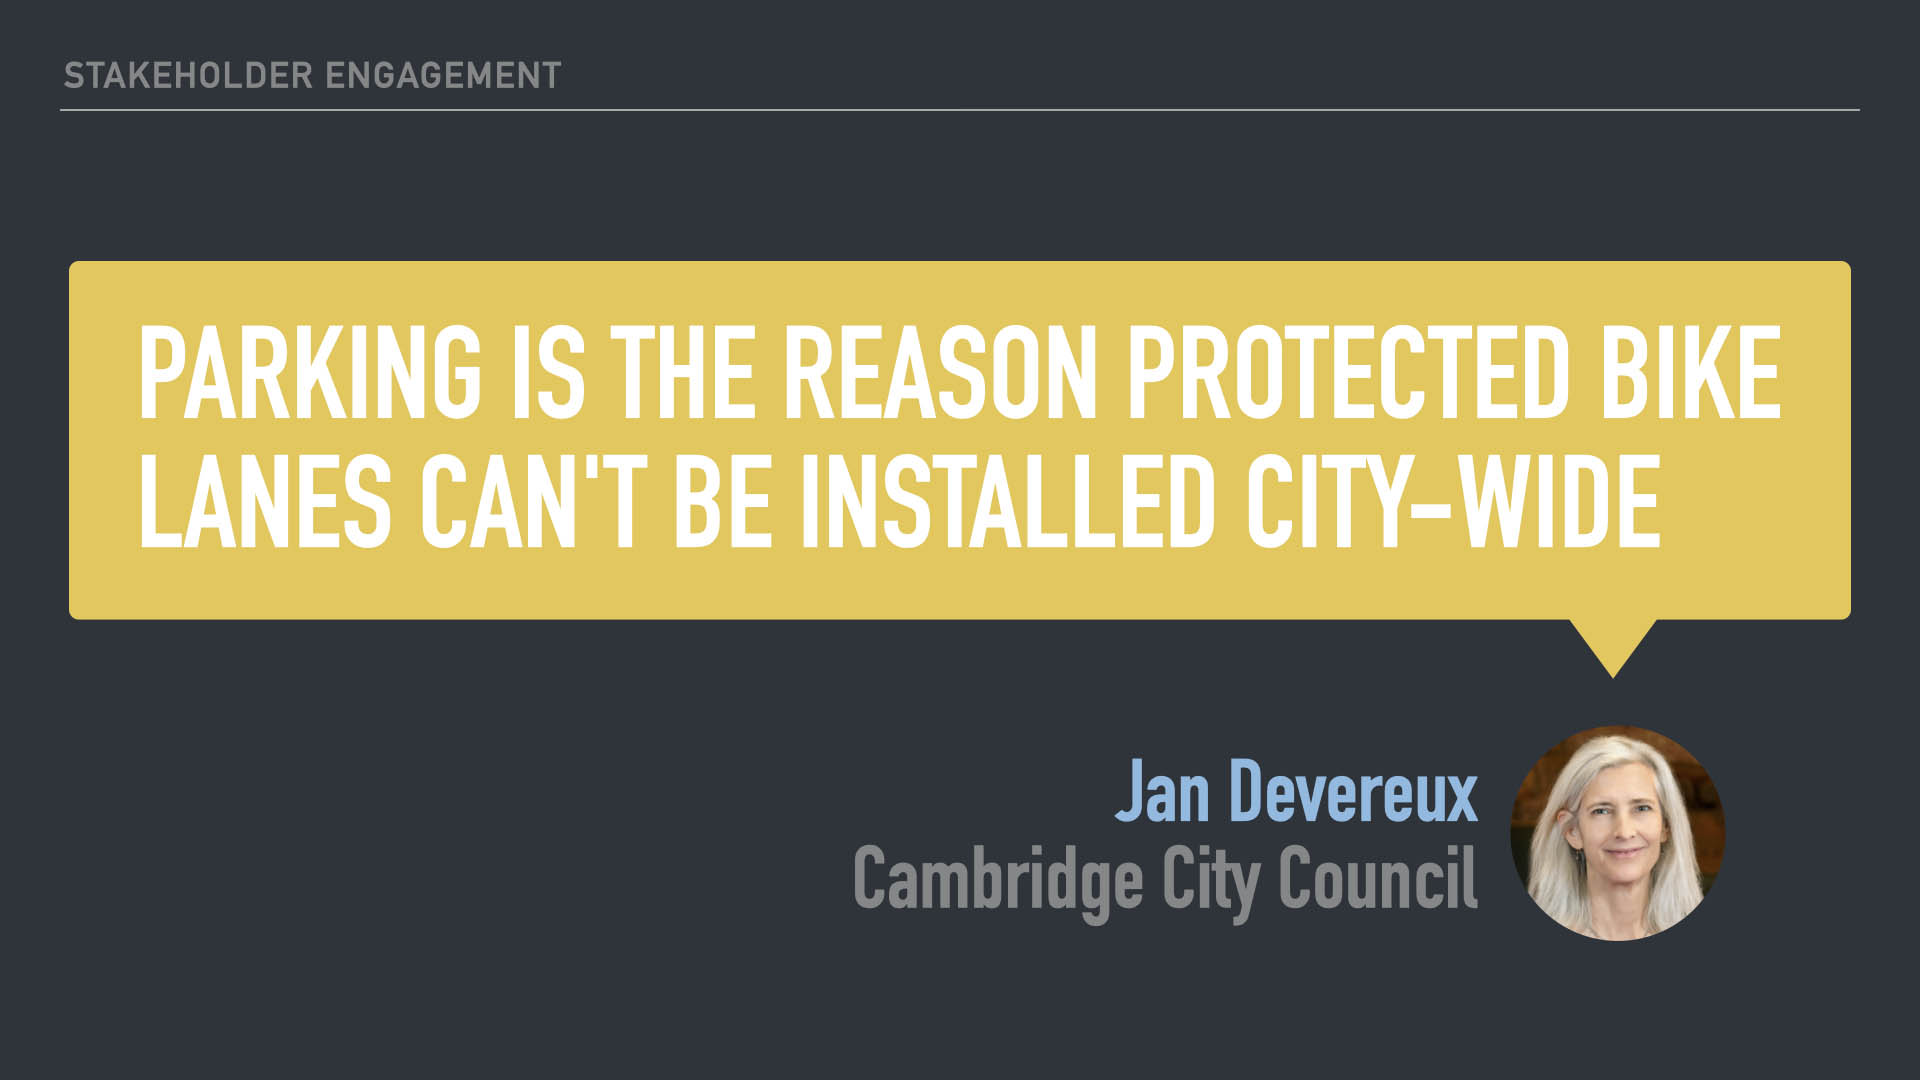
- Comfort Maps starts from the premise that we should have fewer cars in urban centers
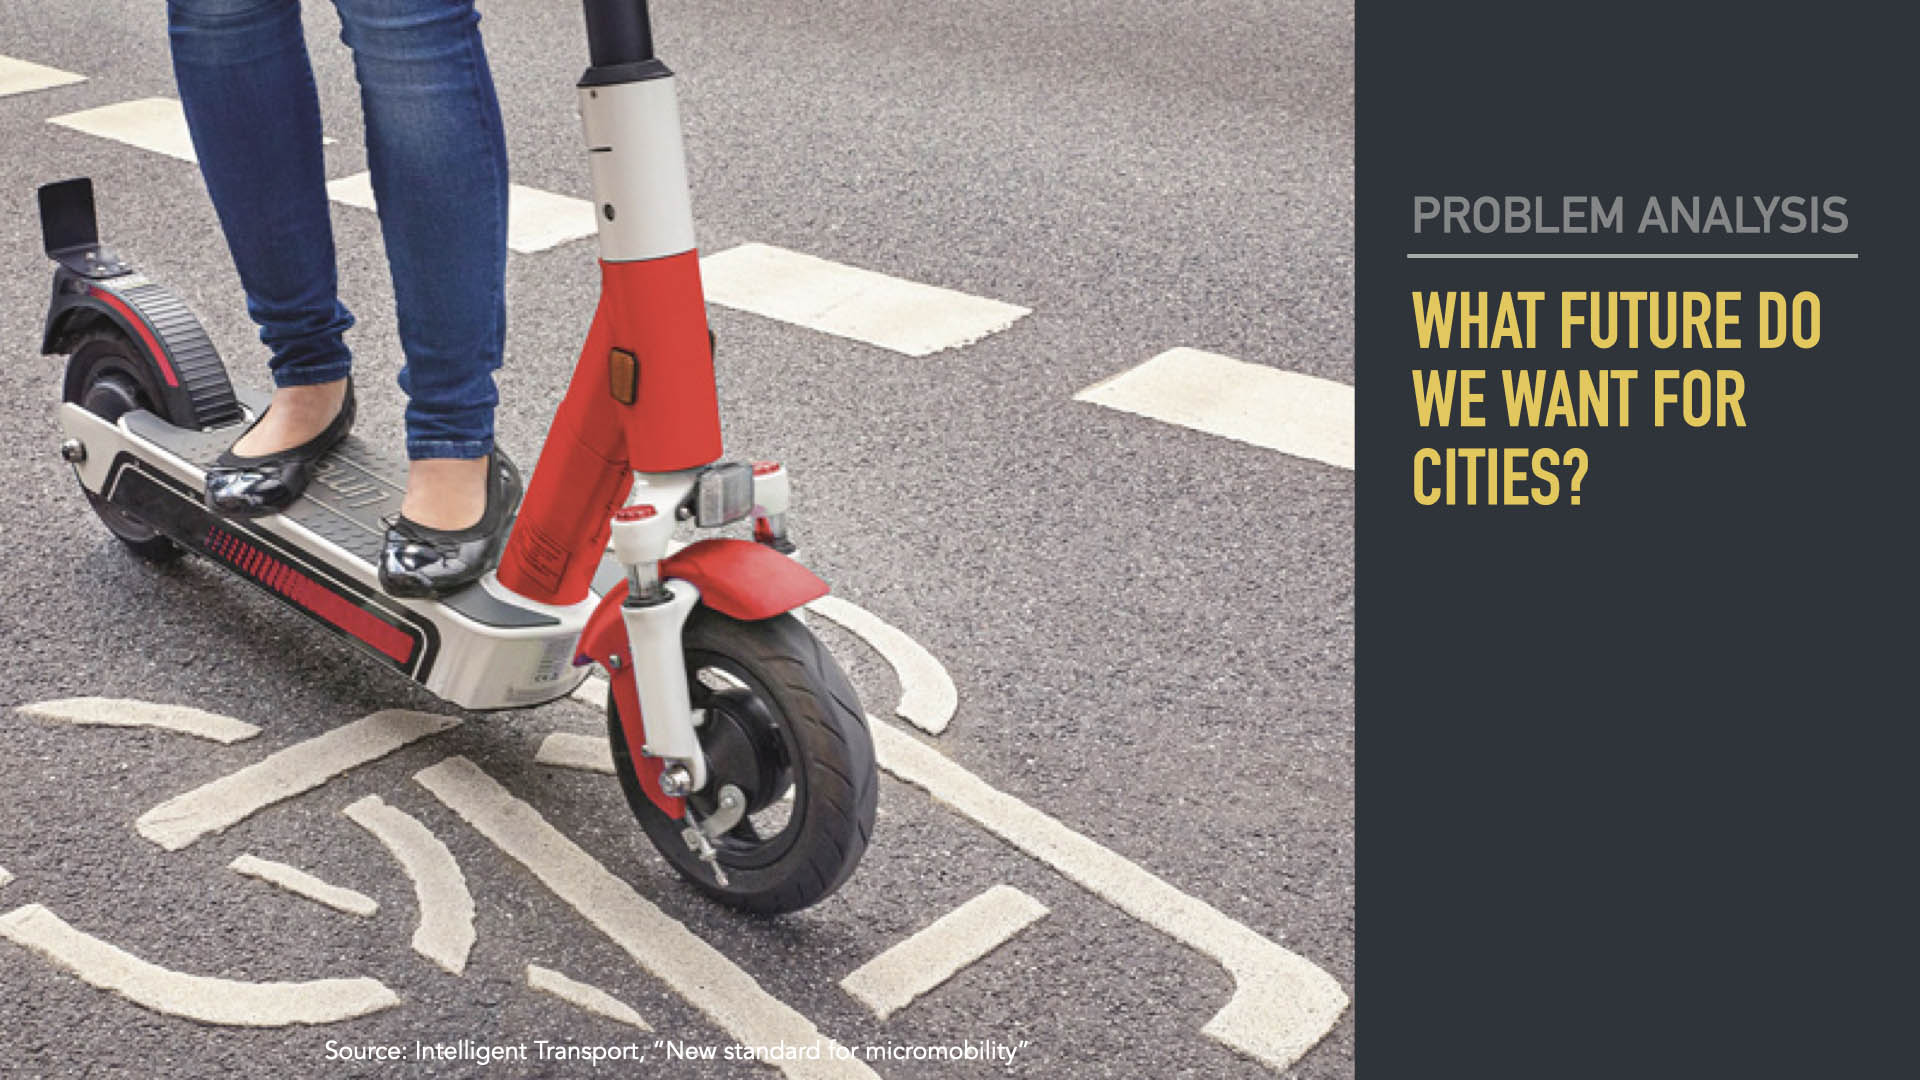
- This is a gen3, it’s not even a spring chicken, a gen 4 is already on the way
- Incentivize new modes, and we reach climate goals we didn’t think possible
- The way to do that is to incentivize low emission vehicles
- And that’s through protected bike lanes
- For advocates it’s obvious that we need to build bikes lanes
- When I spoke to people, it was clear there were many different priorities
- Advocates need help sharing their message
- Policy maker needs good data to make decisions
- And an easy way to hear from constituents
- because that’s what changes minds and gets things built
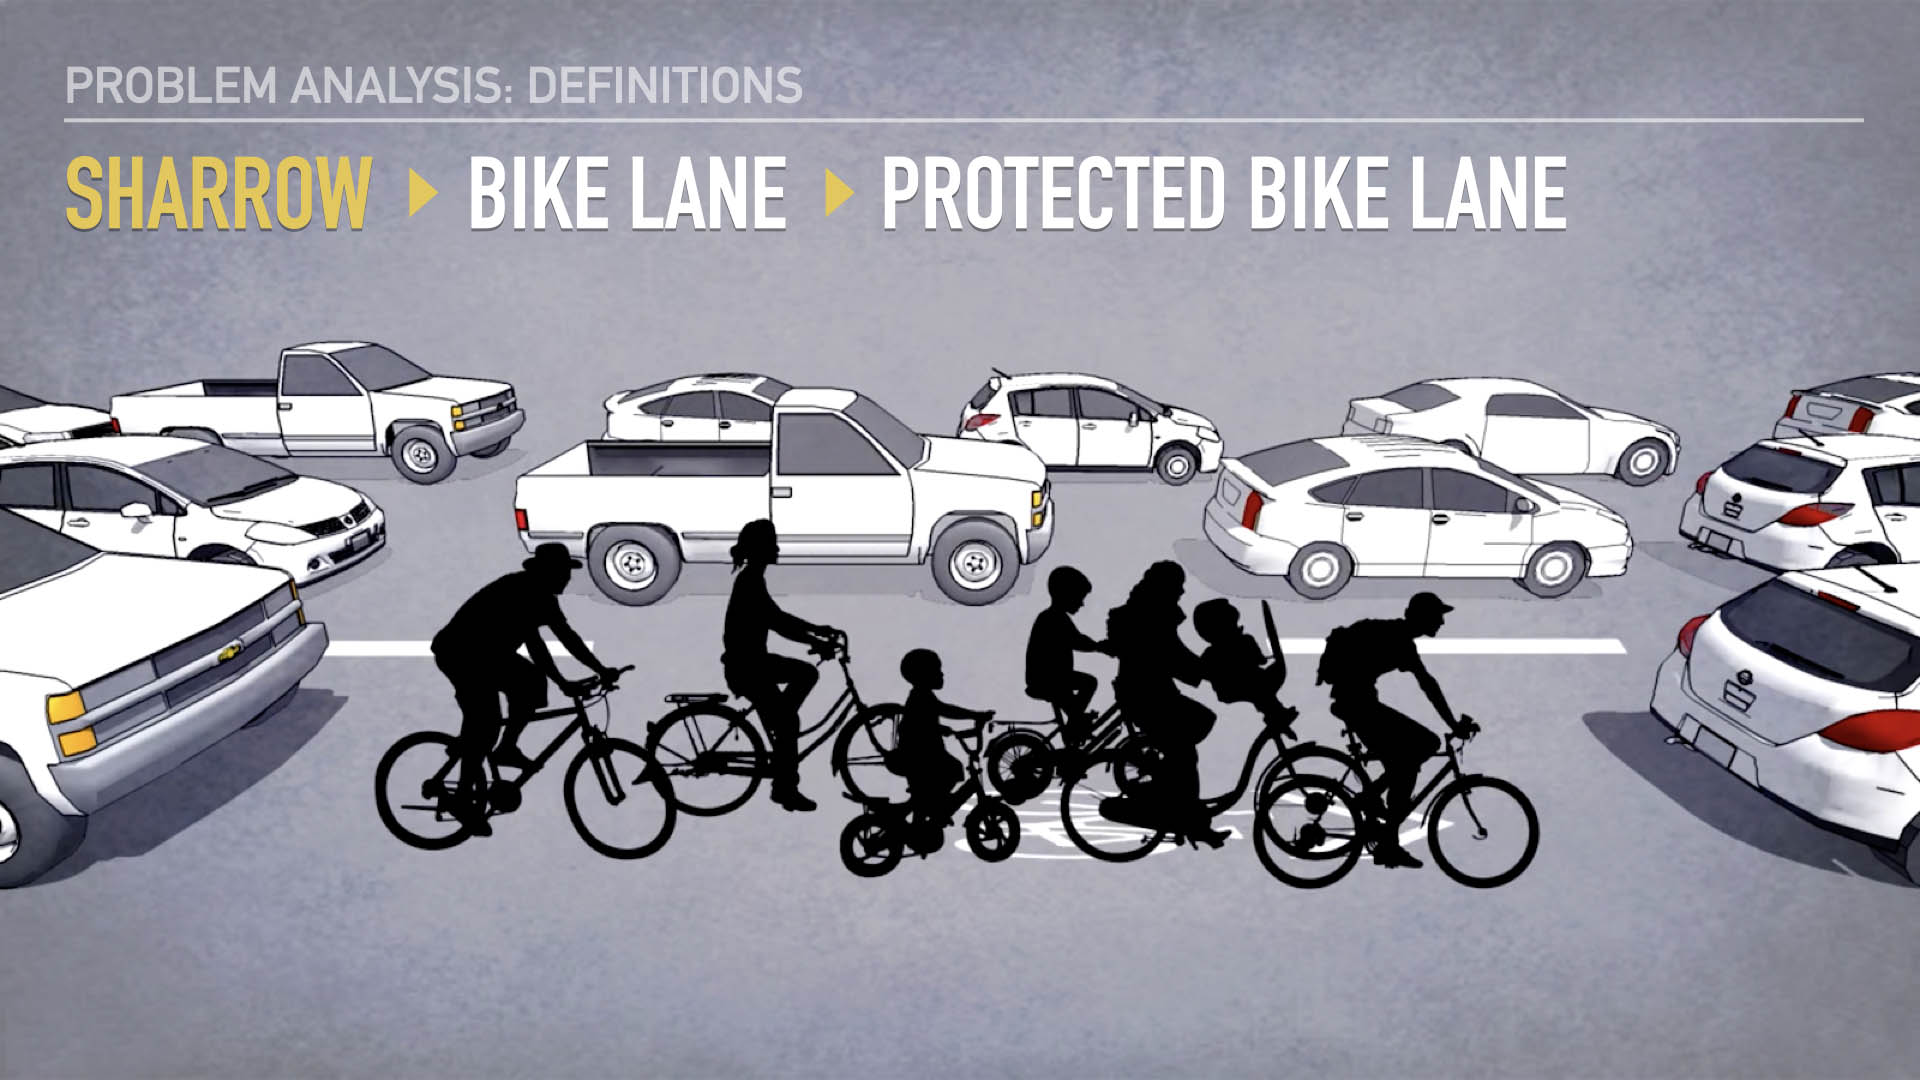
Sharrows
- These are paint, in the middle of the lane
- This is a signal to cars
- According to some 2011 research done here in Cambridge, a sharrow is worth 15”
- Cameras pointed at an intersection, two weeks before, two weeks after installing sharrow
- On average, cars gave 15” additional space to cyclists. That’s not nothing.
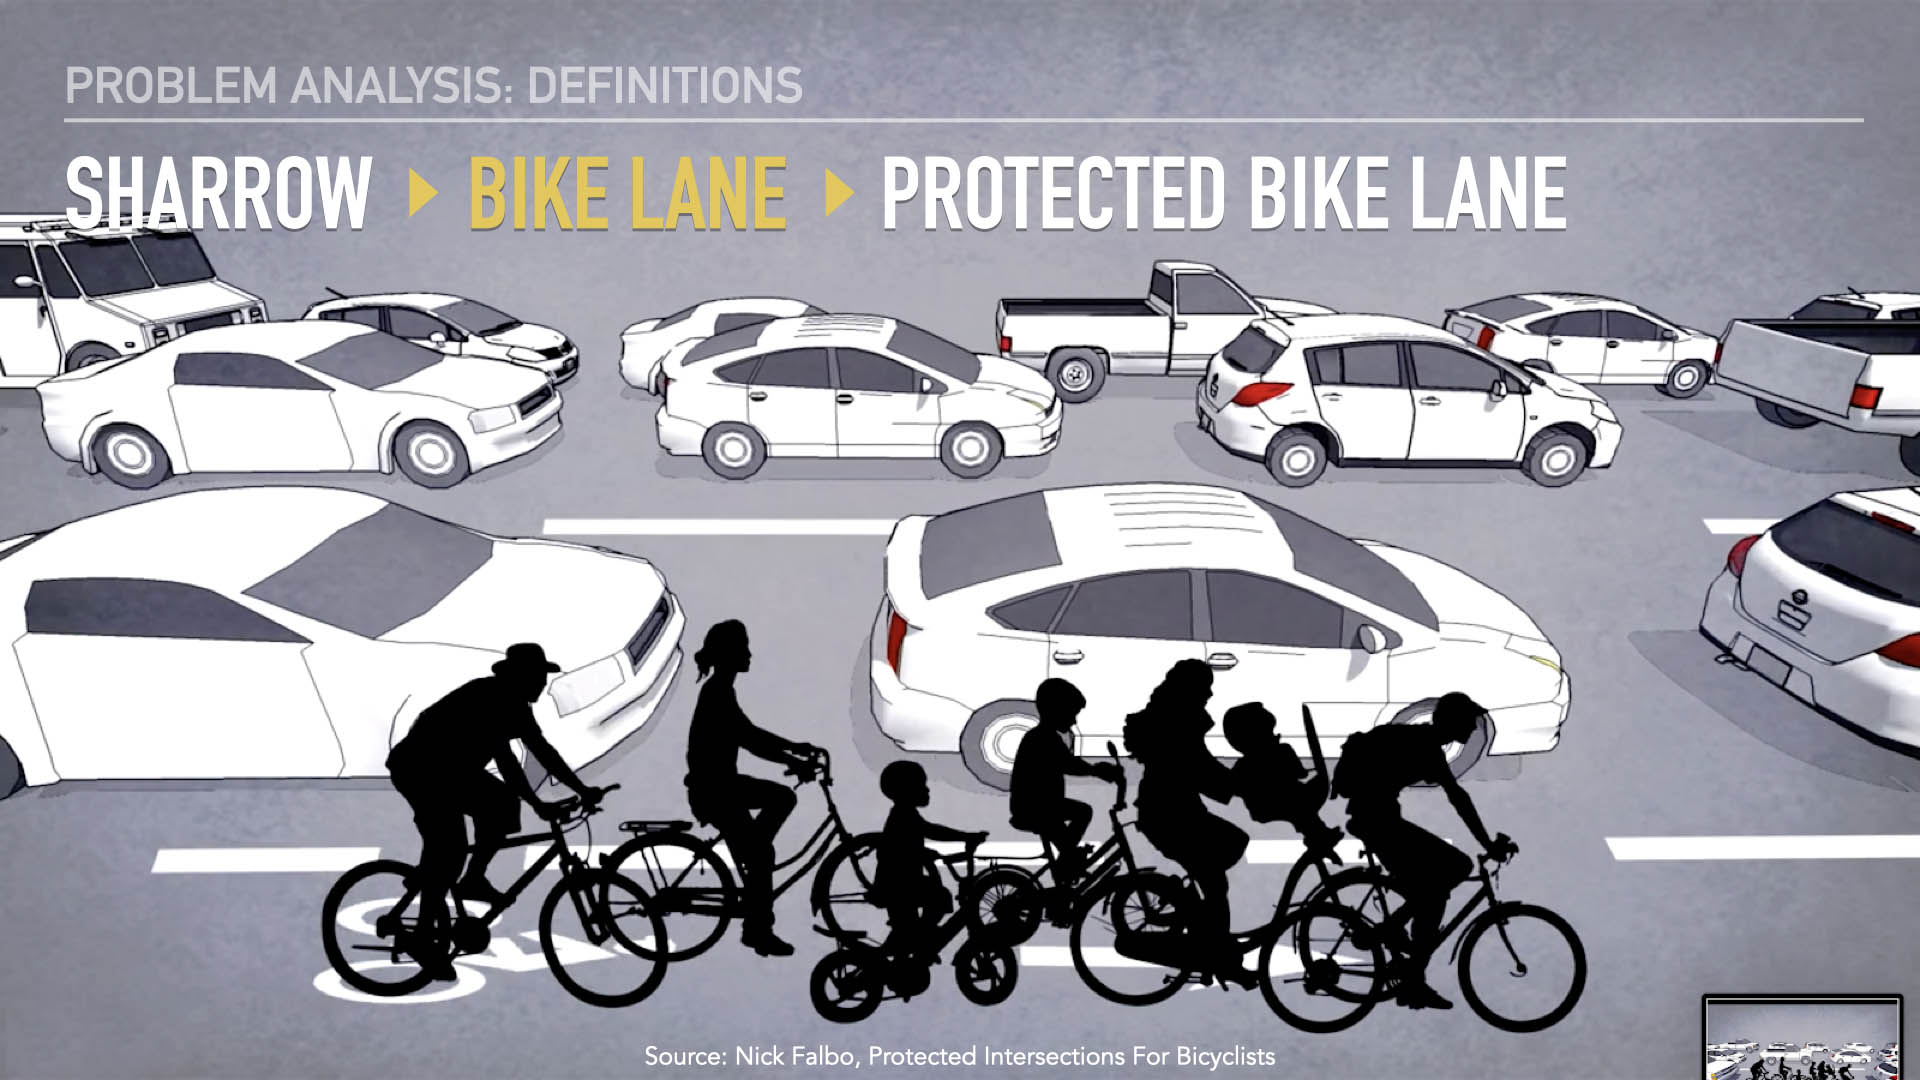
Traditional bike lanes
- Protection is bounded by the mindfulness of drivers beside you
- It’s just paint.
- Nothing between the slow lane and the fast lane.
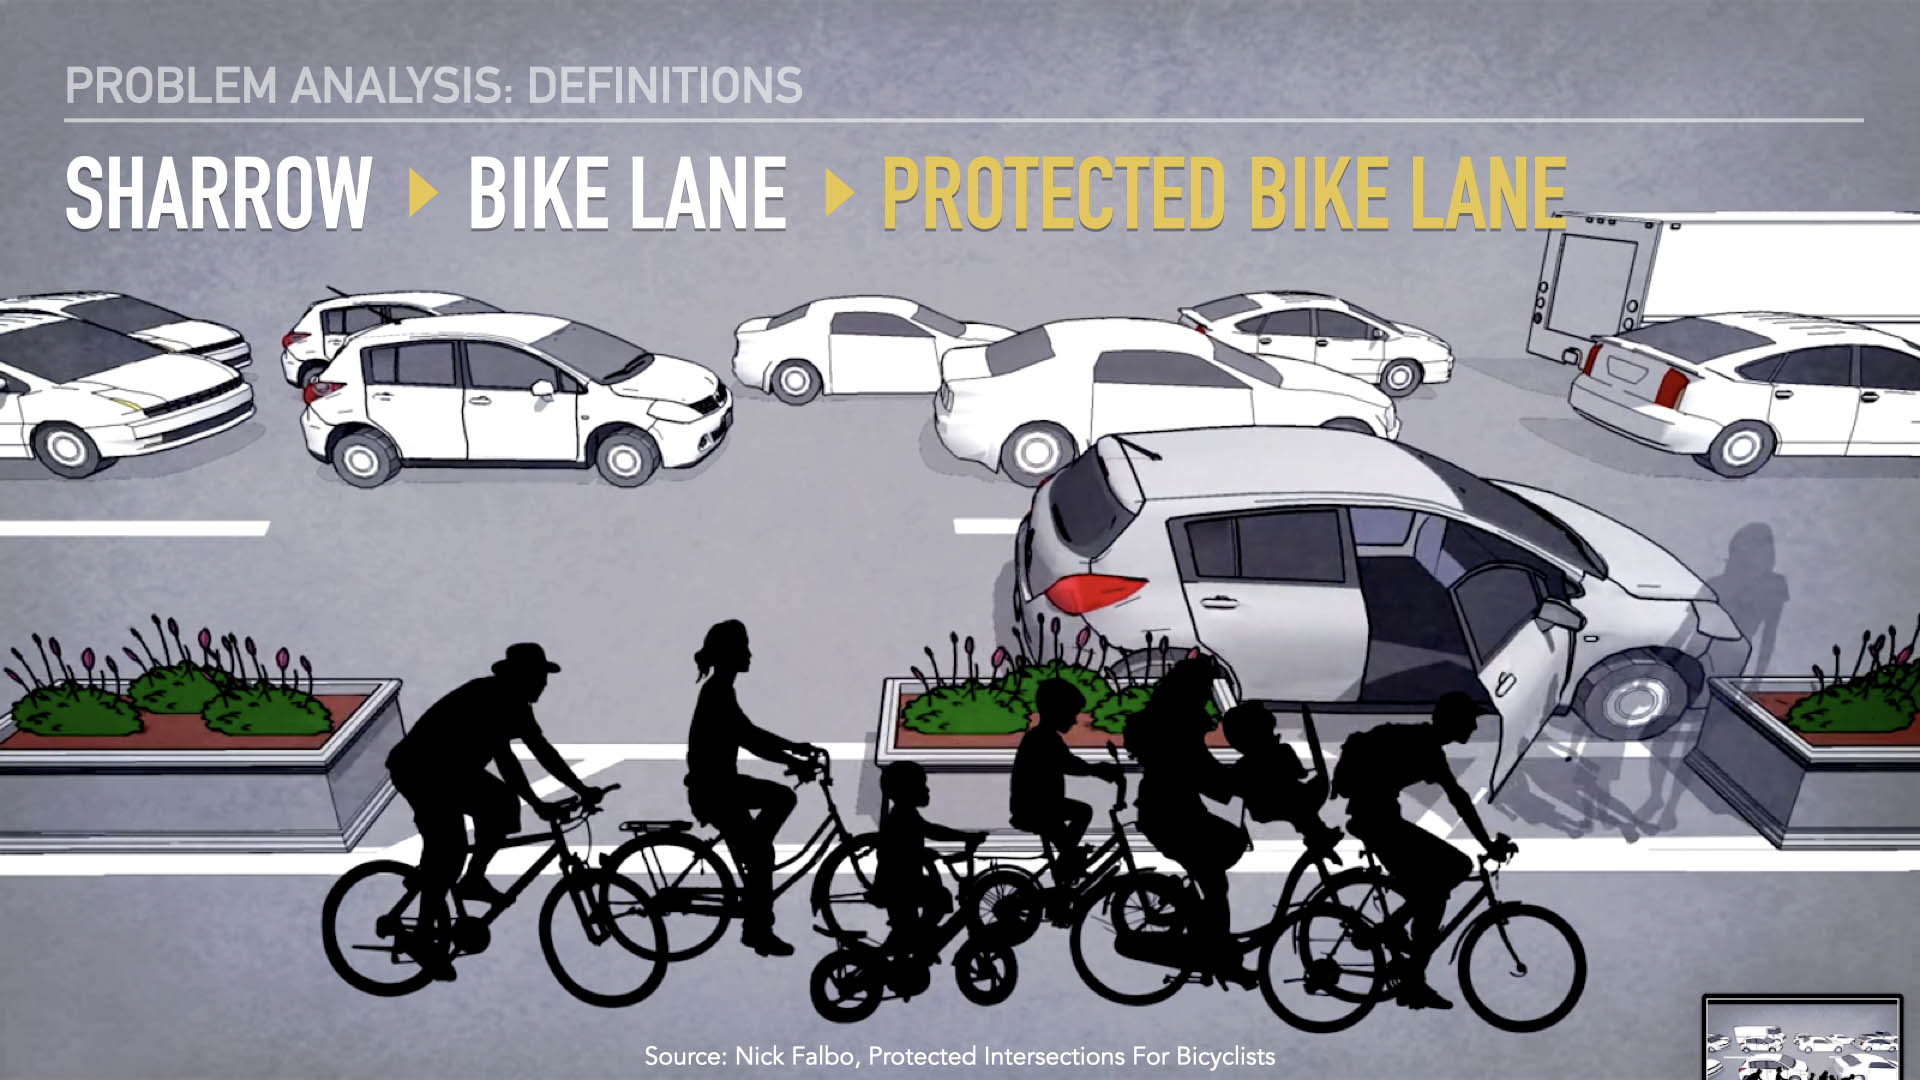
Protected bike lanes
- A PBL is the gold standard
- This is a barrier, whether it’s bollards, or stanchions, or plants, and even parked cars
- All bike lanes have their worth, but they are not equal
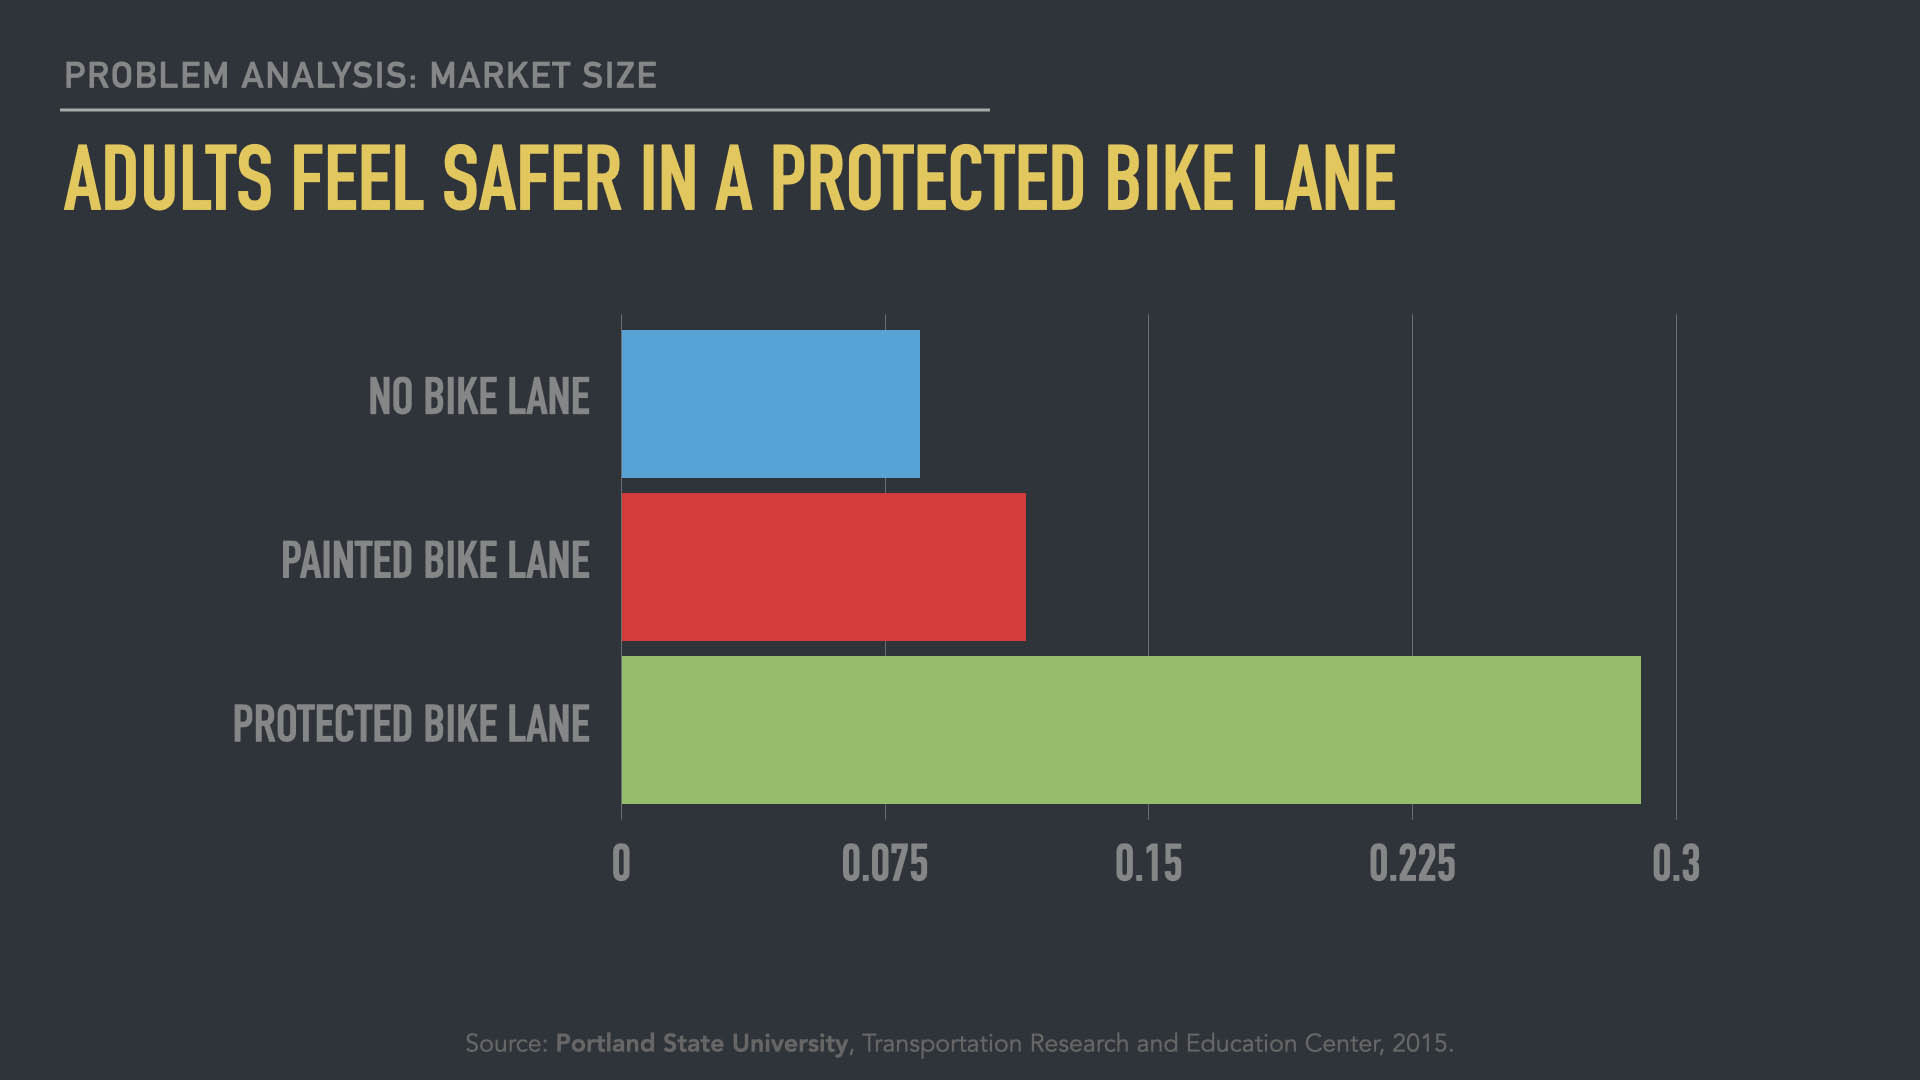
- 2.5 times safer in a PBL than in painted bike lanes
- Barriers matter
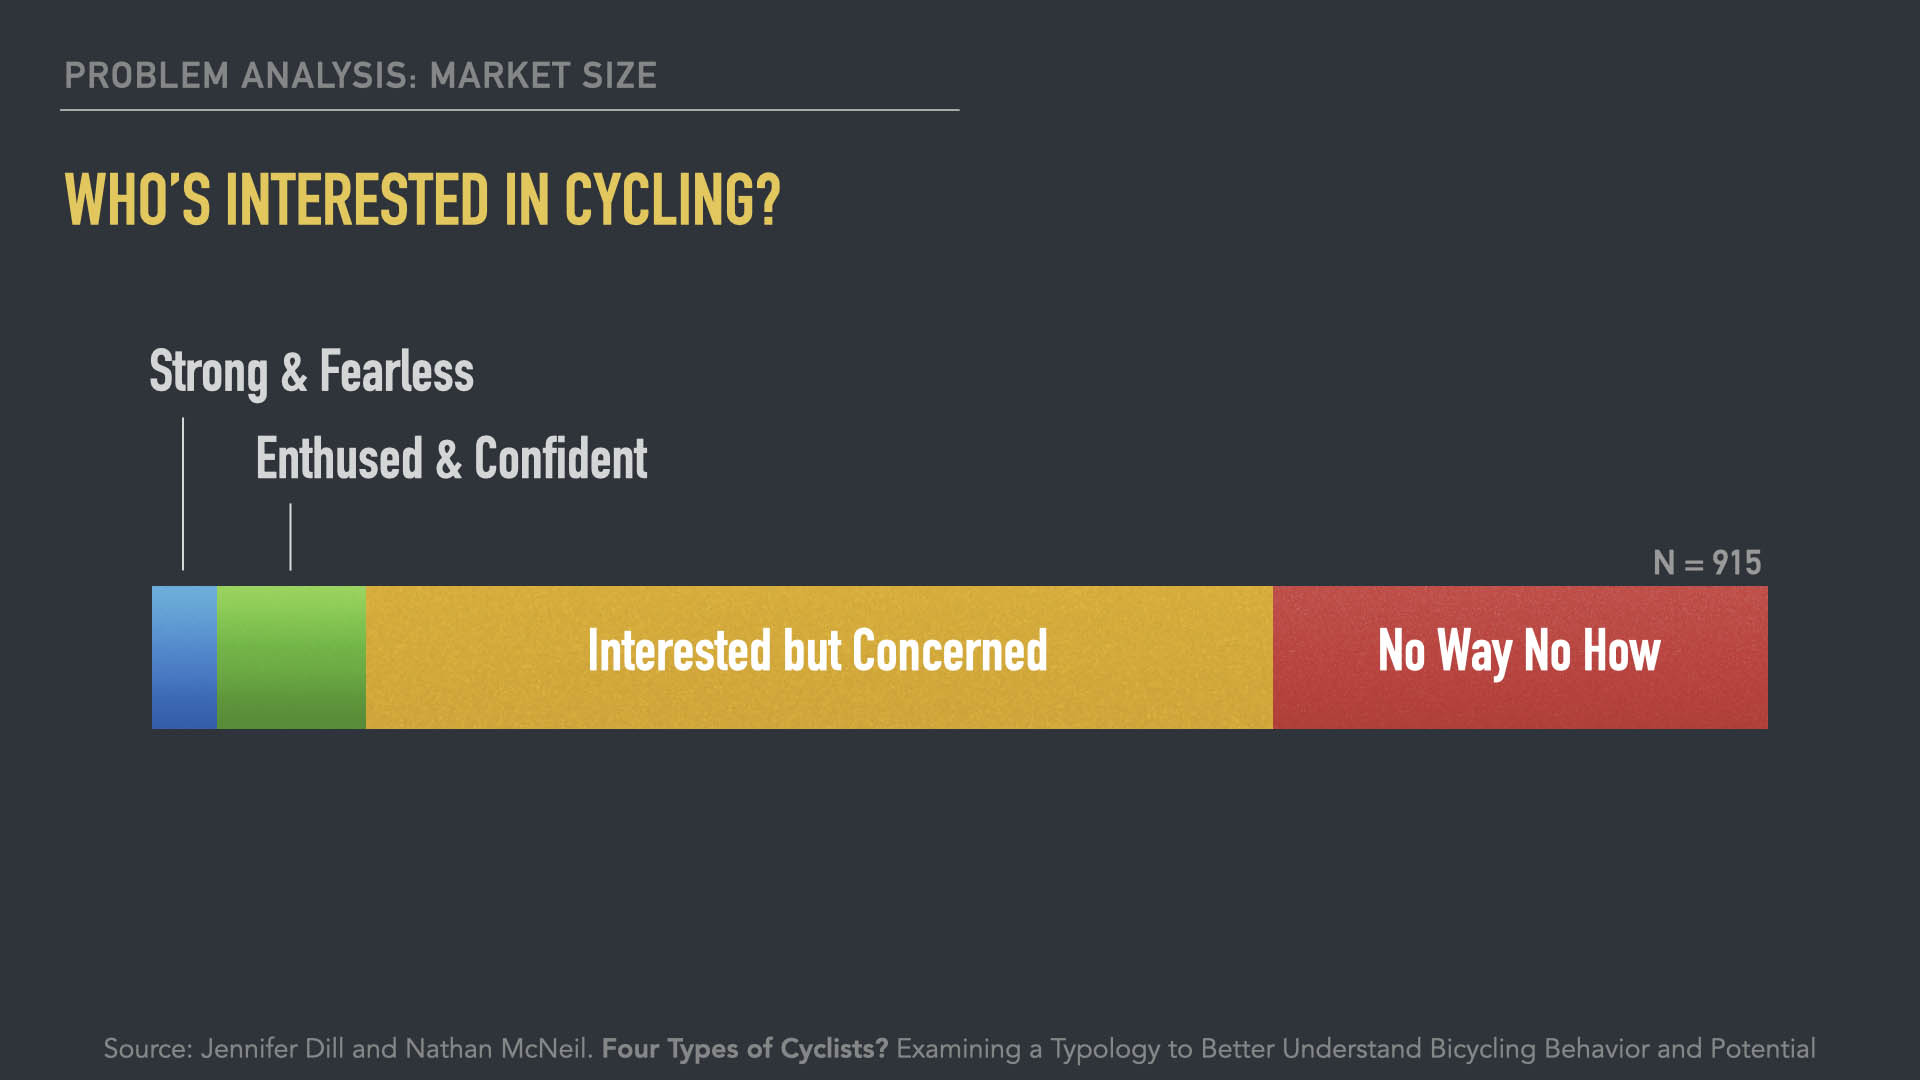
Zooming out…
Strong & Fearless 5%:
Enthused & Confident 10%:
- Basically everybody here who bikes
No Way No How 30%:
- We should protect the ability to drive, because one day all of us will need it
- Includes recreational
- If they had PBLs, maybe they’d bike
Interested But Concerned 55%:
- B/c a bike commute is only as strong as its most terrifying road segment
- So I set out to find out how bike lanes are built
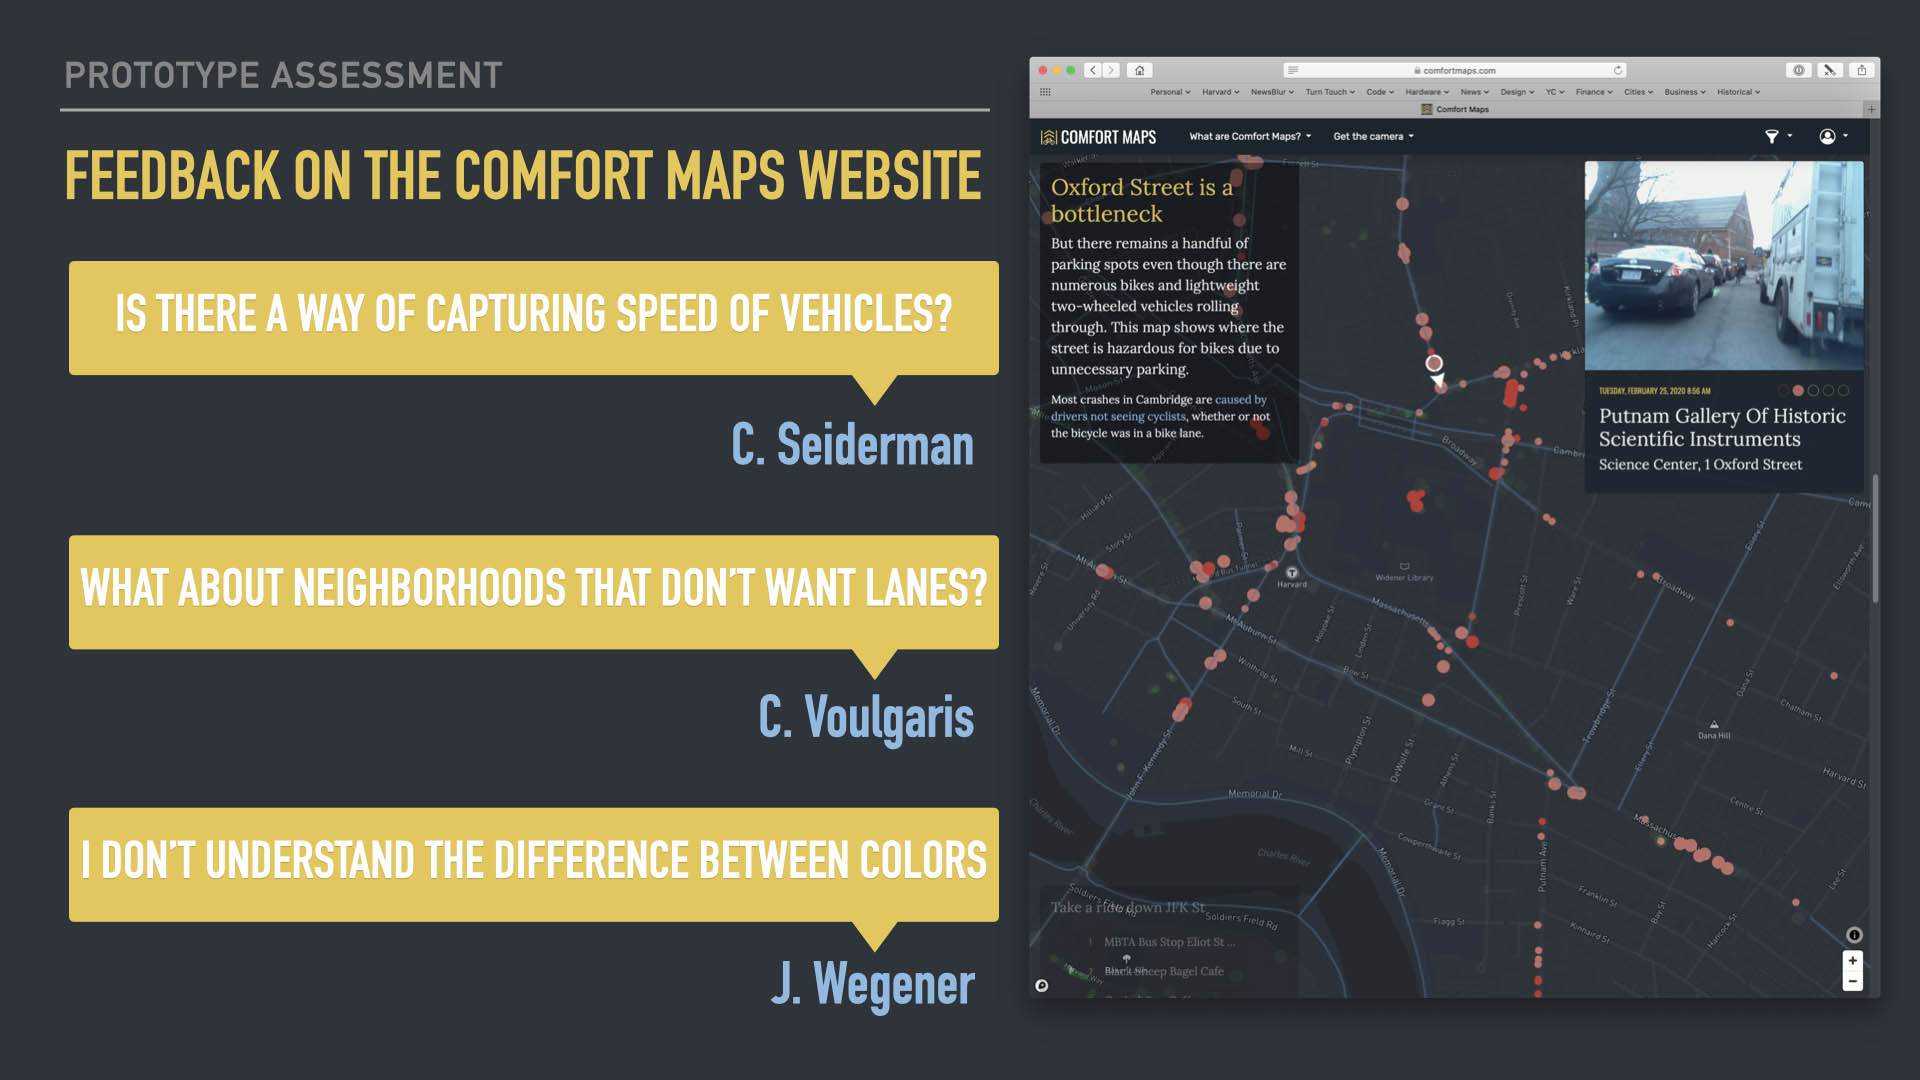
- I interviewed a dozen people involved in the process of building bike lanes
- Tensions between businesses, motorists, cyclists, and pedestrians
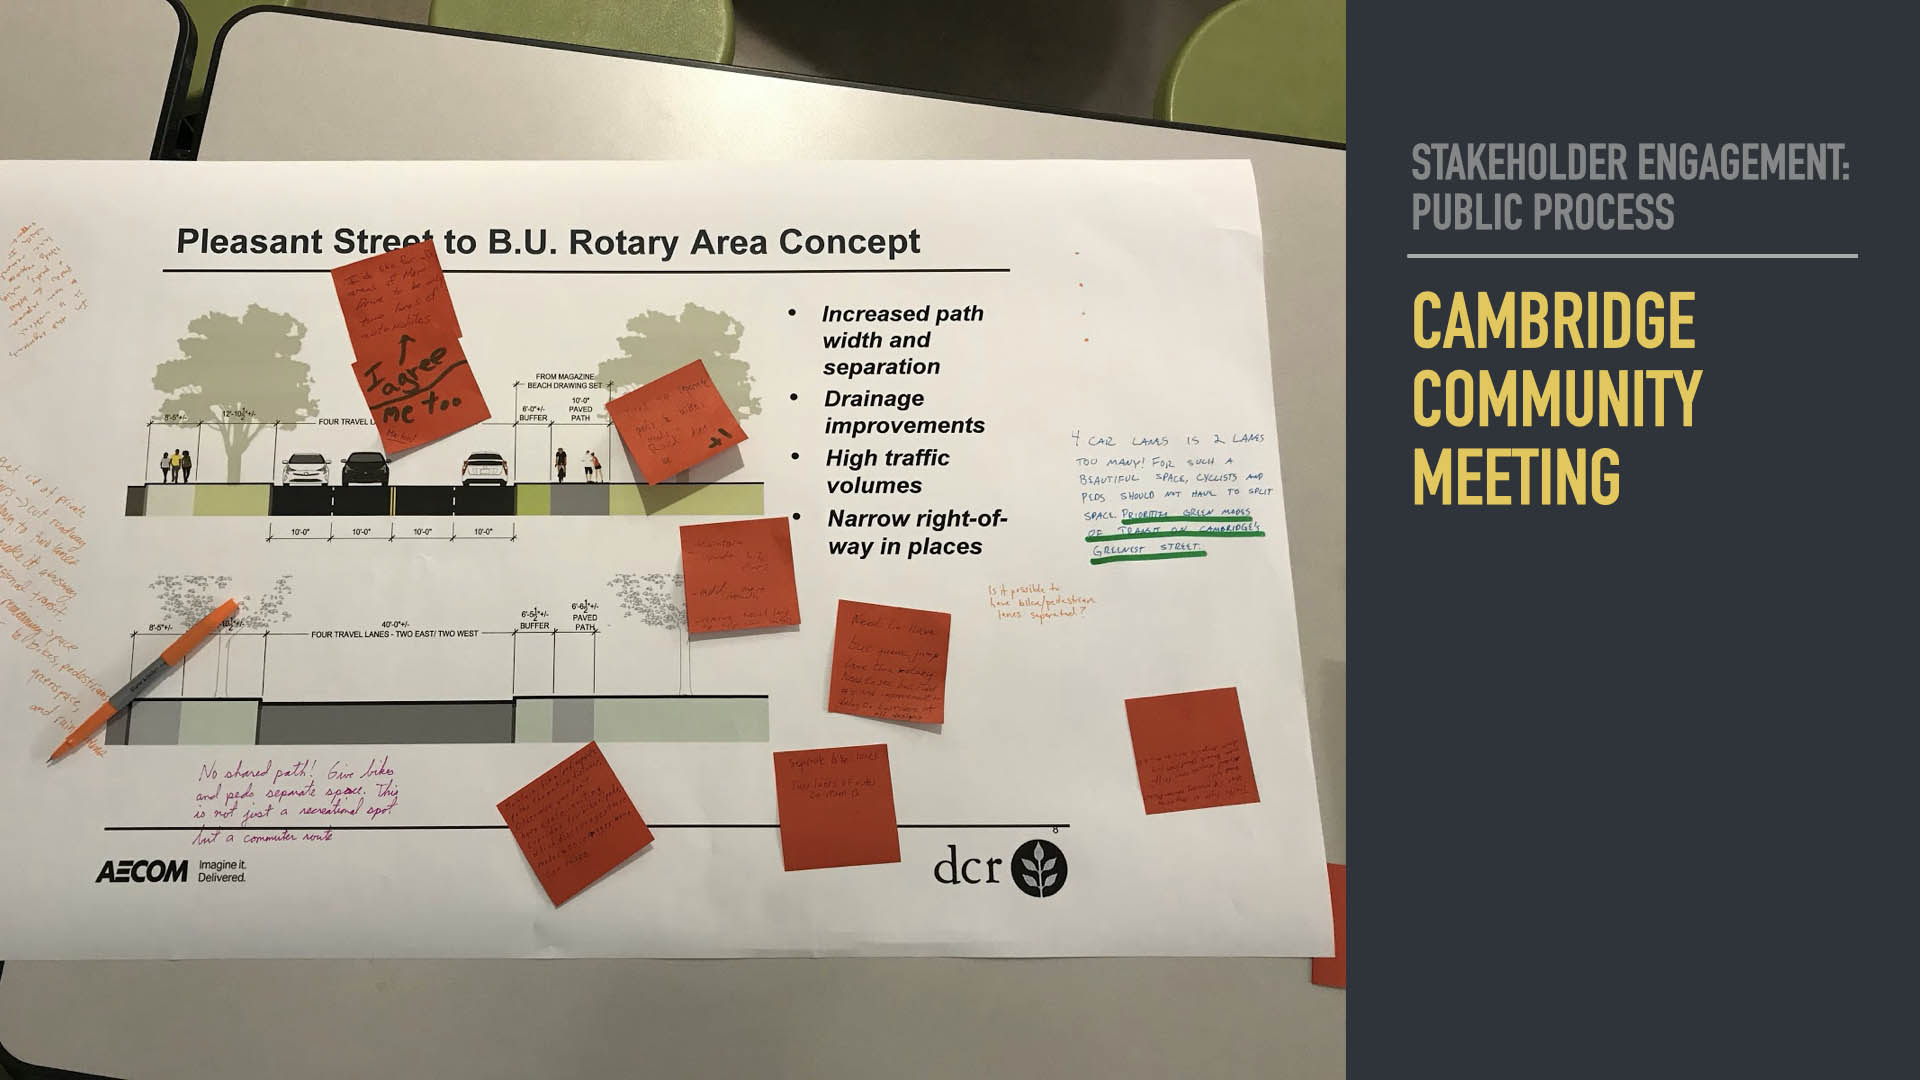
- Hear what people say in a public forum to their elected reps
- Provide an outlet for the public to voice concerns on the record
- Here it’s a protected bike lane on Memorial Drive being proposed by the Department of Conservation & Recreation here in Cambridge
- Objections are about weather, emergency vehicles, and parking
- Truth is, this is still reactionary
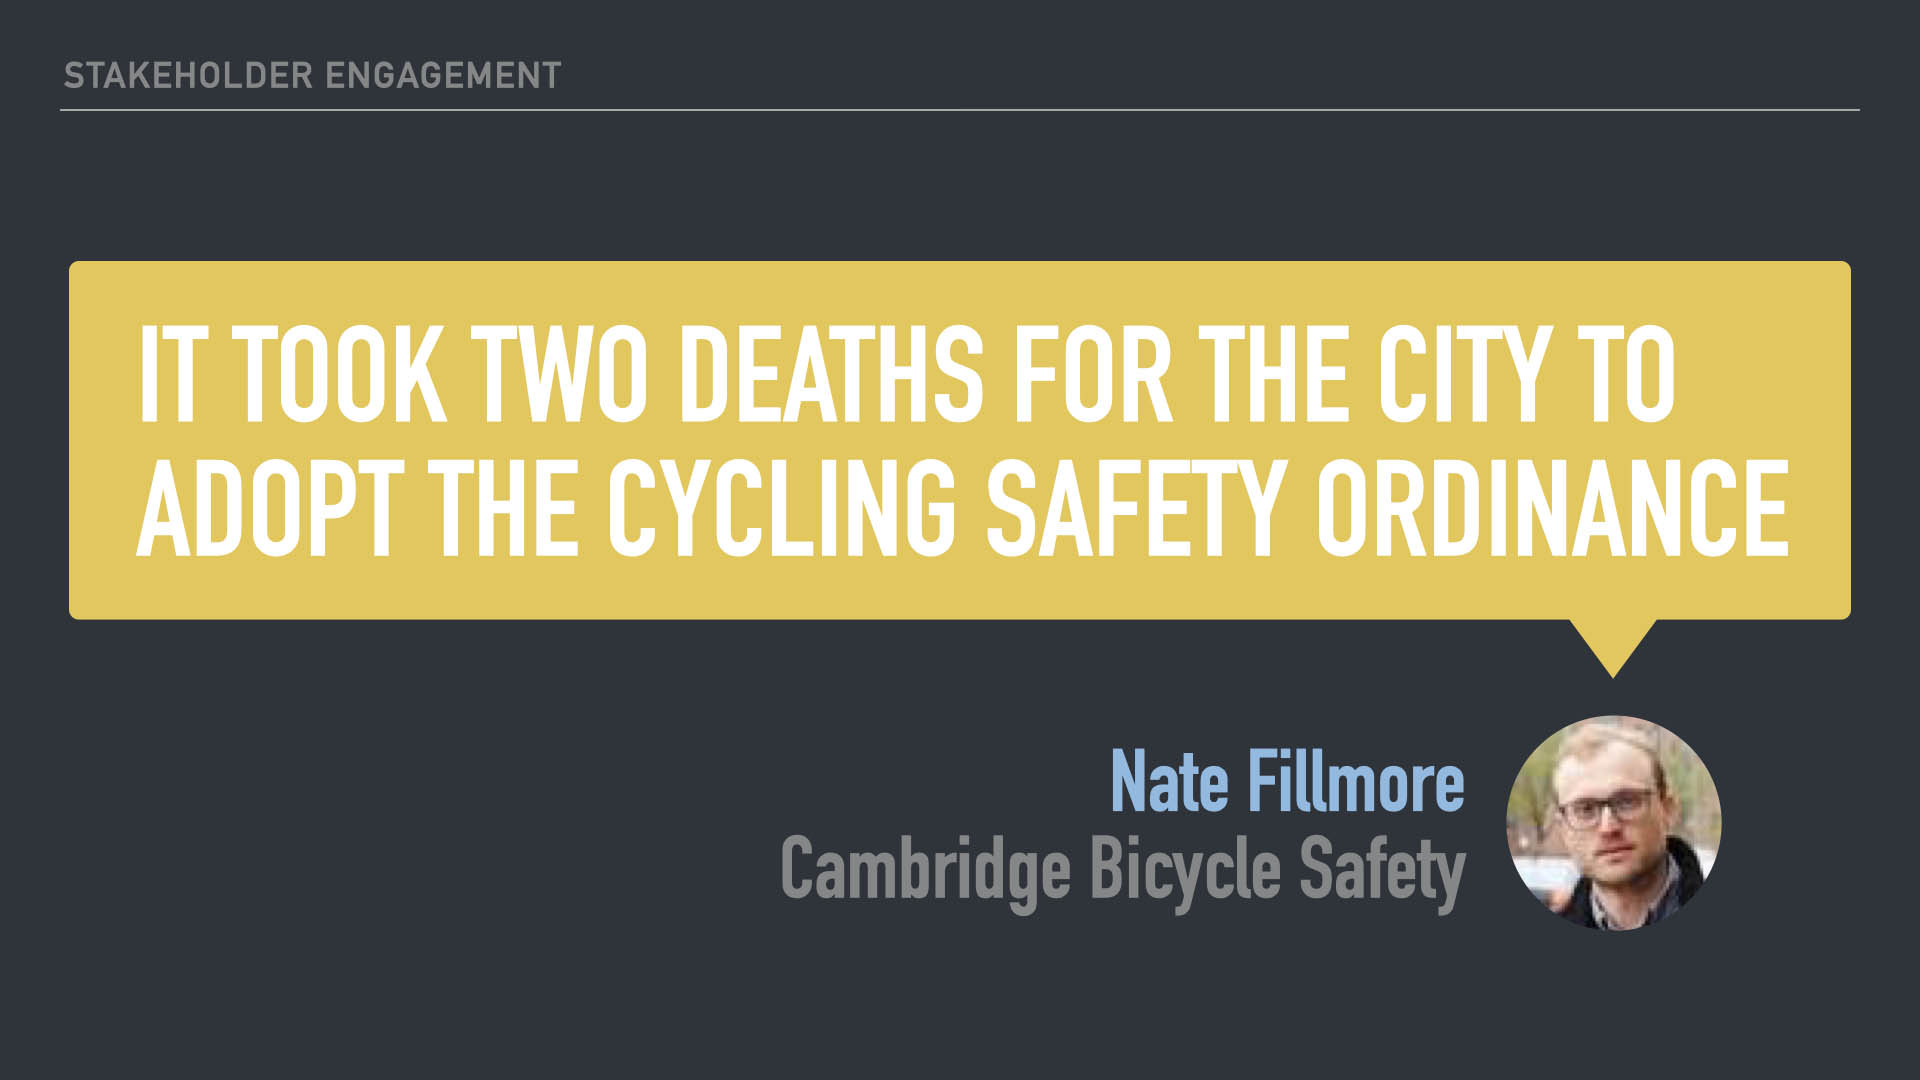
- Even with the Cycling Safety Ordinance, which ensures the gradual building of separated bike lanes,
- We will see twenty more years of unnecessary deaths caused by lack of safe biking infrastructure.
- We can do better, but we should be more proactive than reactive
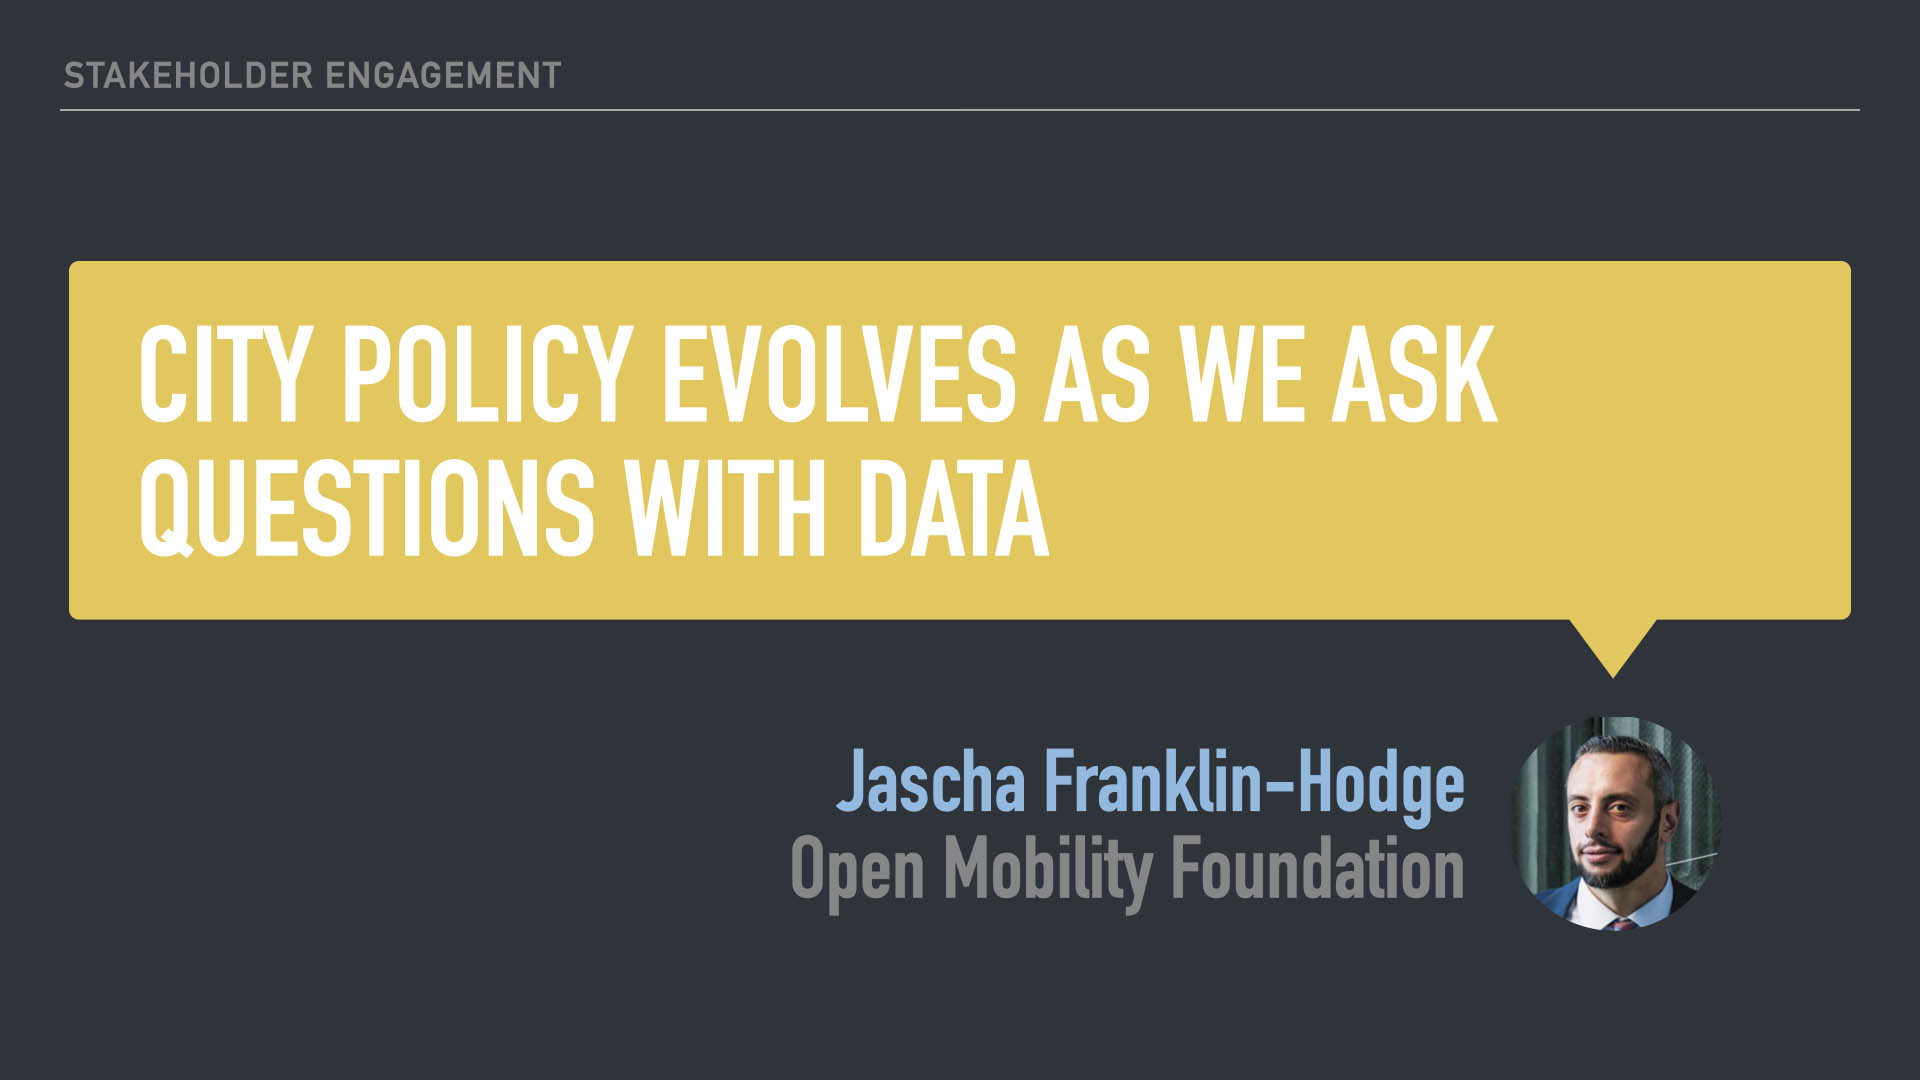
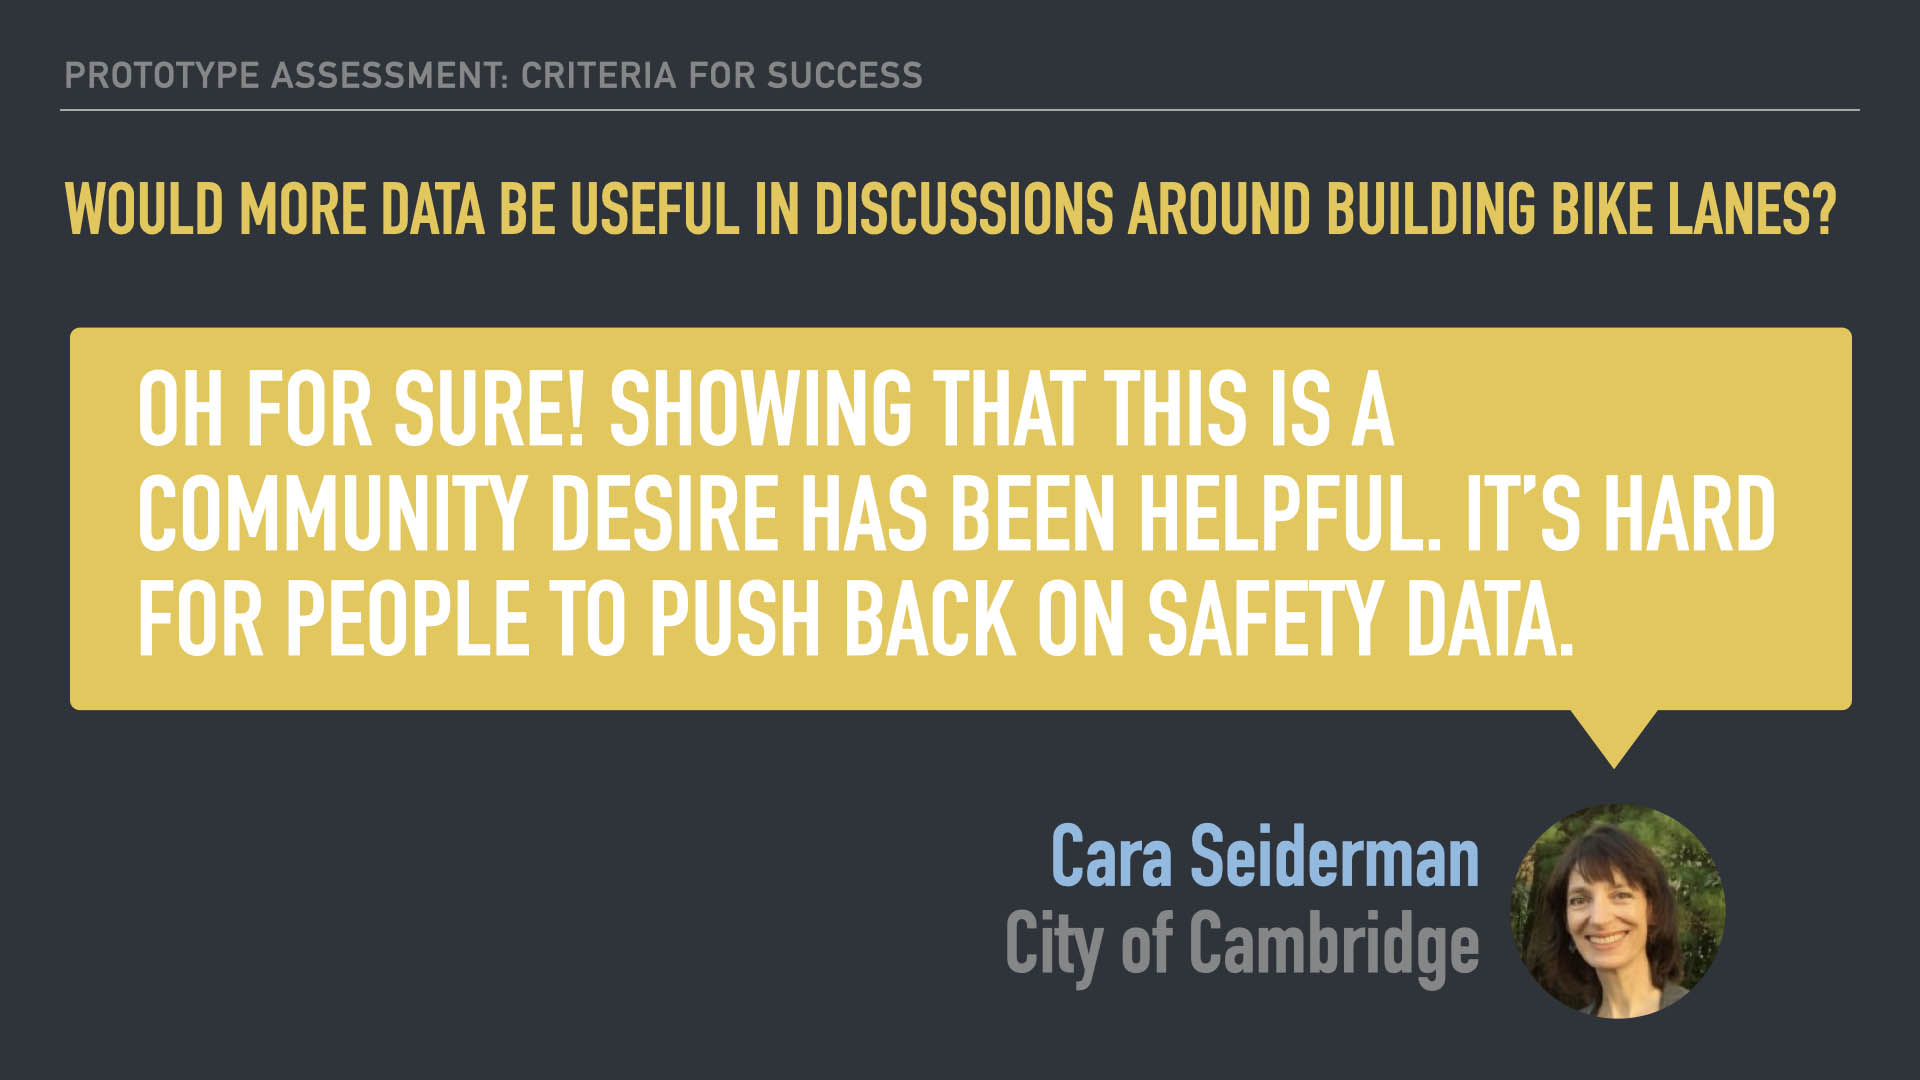
- And I think better data can help
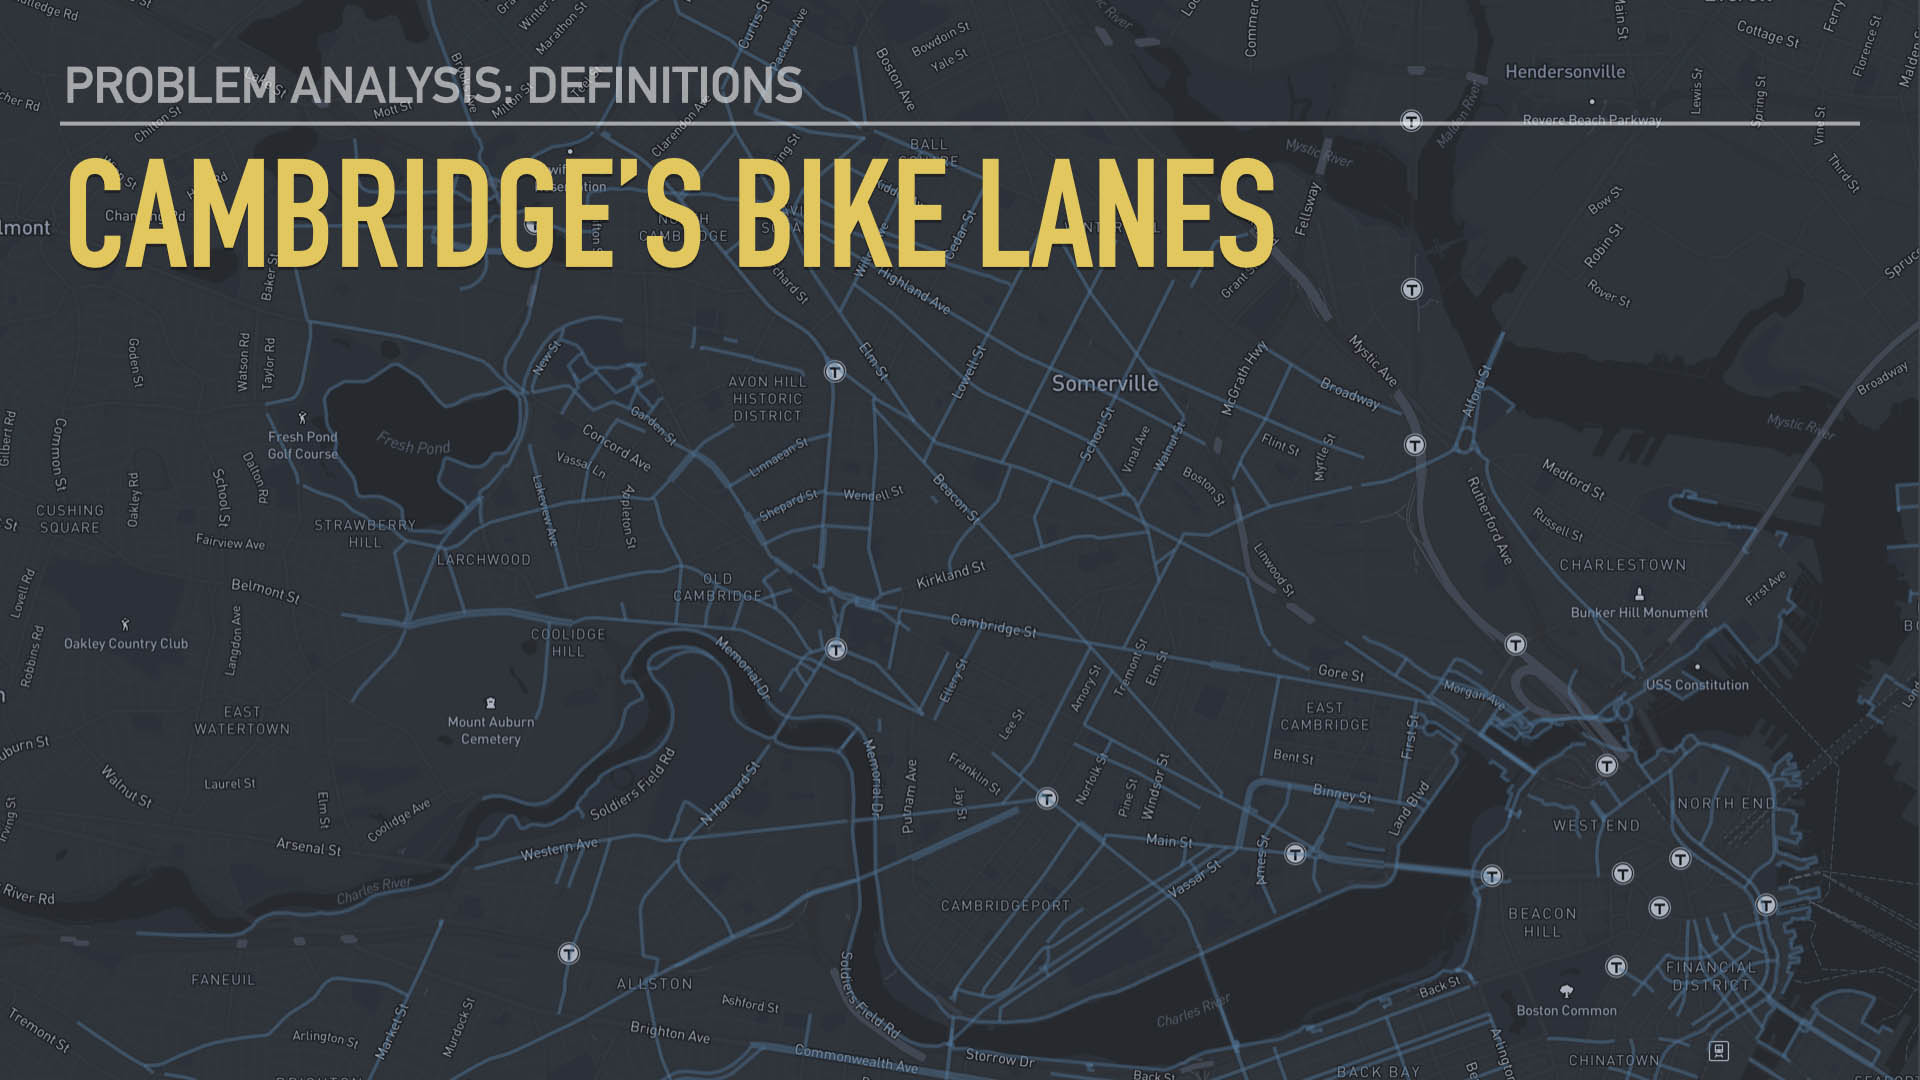
- So what does that look like here in Cambridge
- Our perspective is CITY POLICY EVOLVES AS WE ASK QUESTIONS WTIH DATA
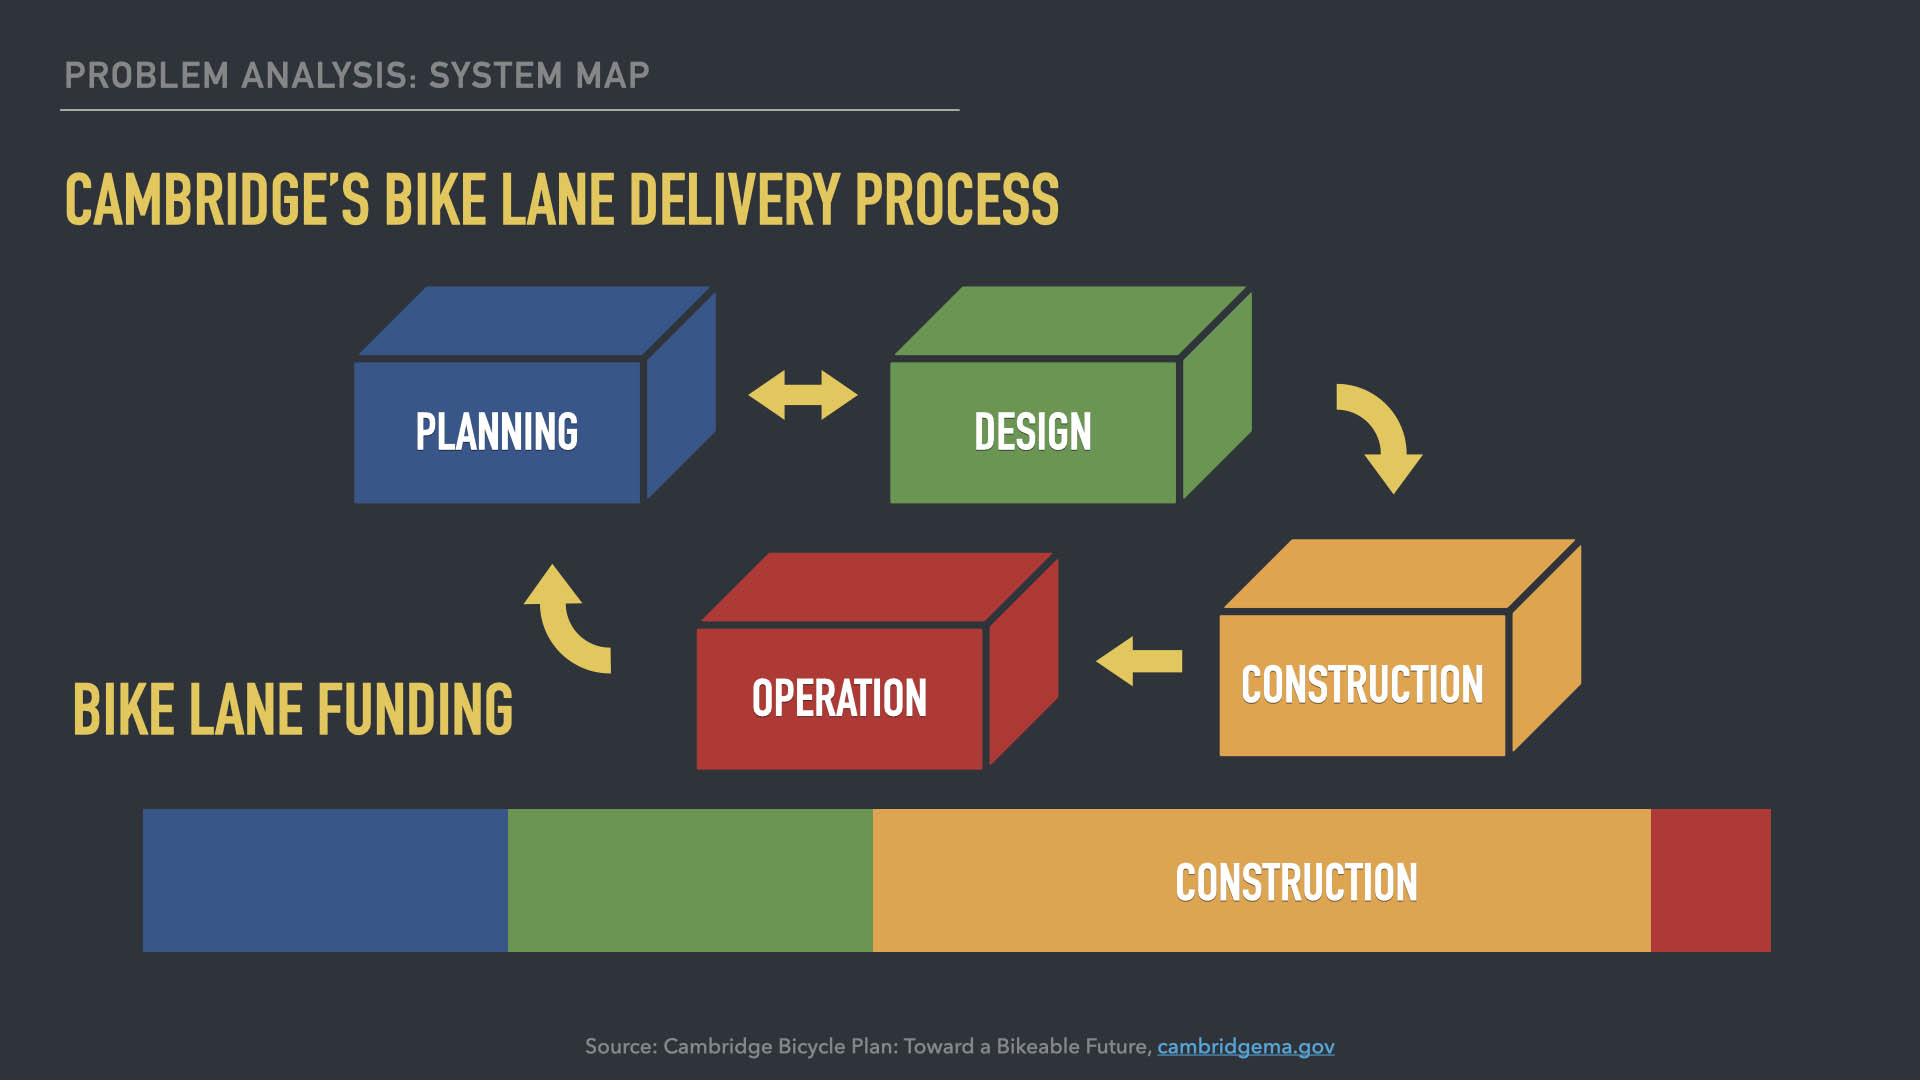
So let’s think about where the data can make a difference
Planning:
Design:
- Detailing what those streets look like
Construction:
Operation:
So how is it paid for?
- Cambridge does things differently
- We have participatory engagement
- There’s a lot more feedback mechanisms built in and that costs money
- But here that provides an opening for advocacy
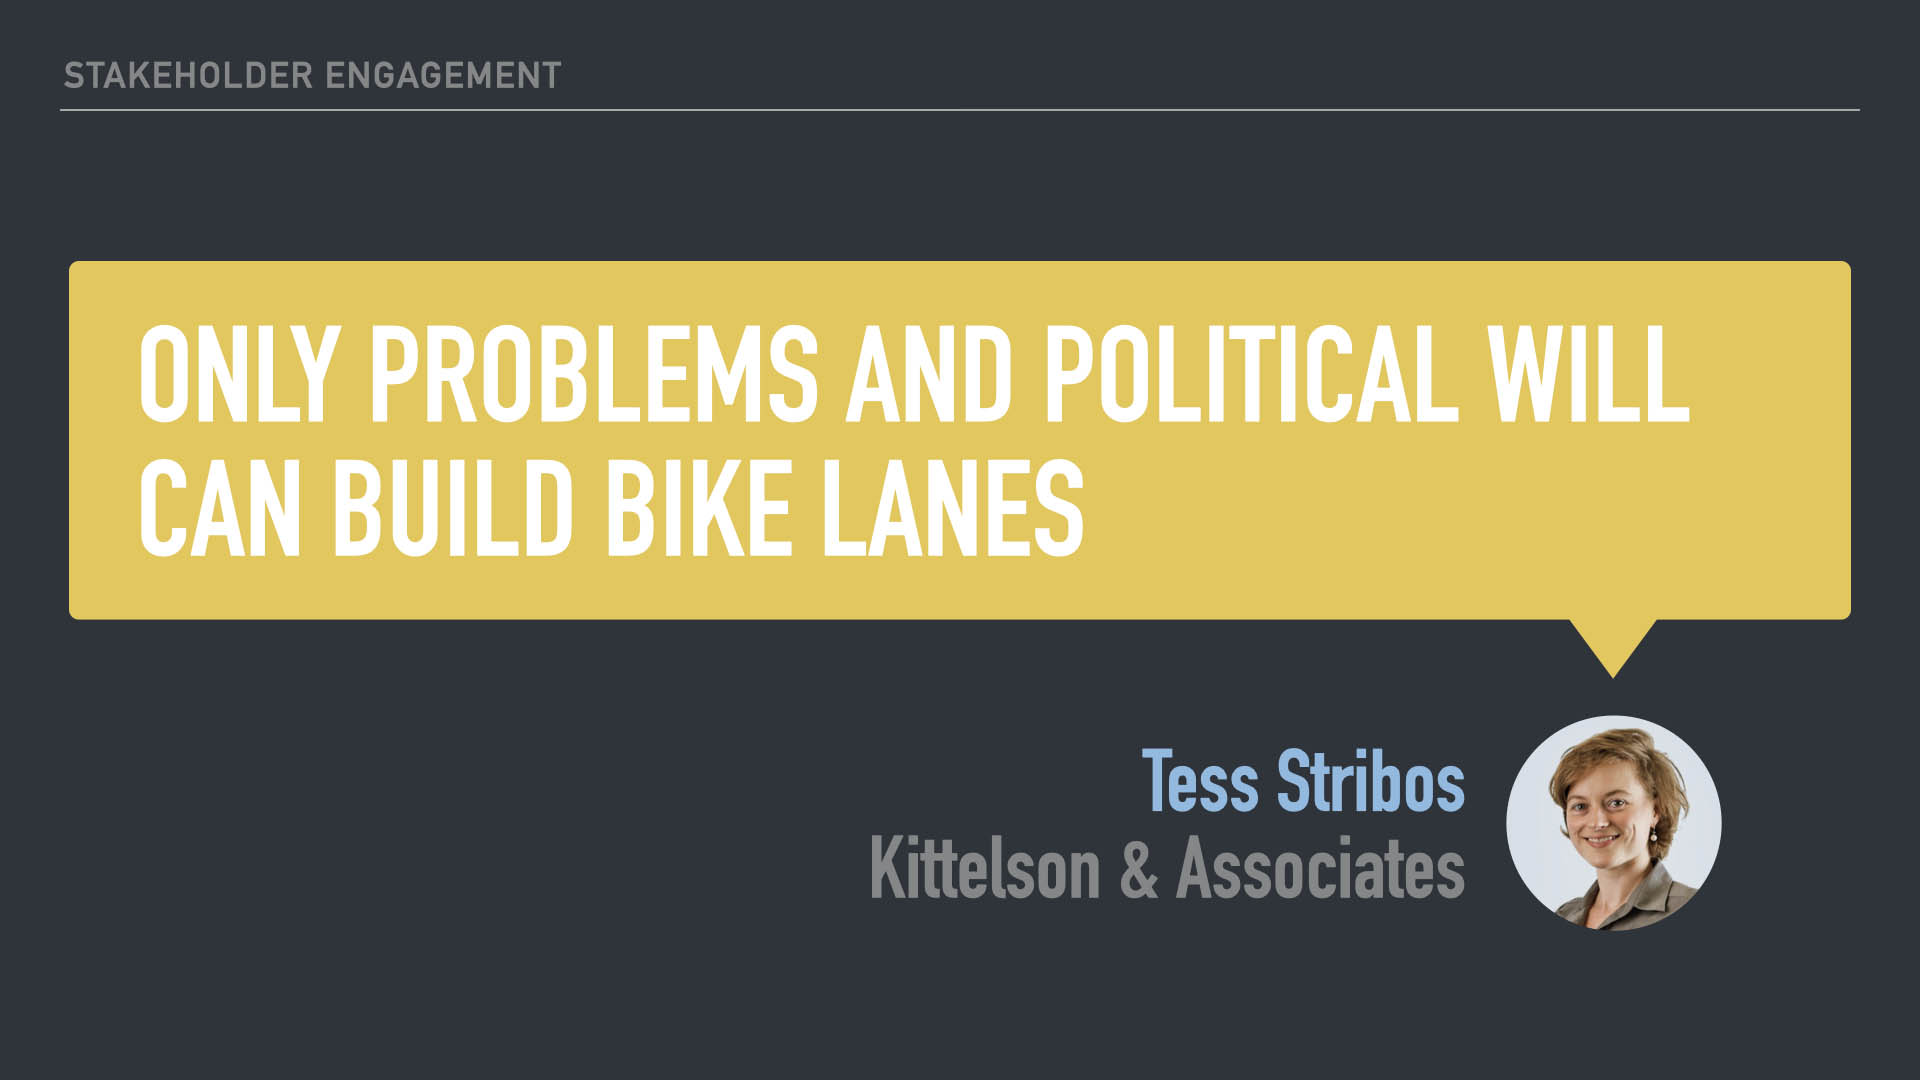
- Because the Truth is, ONLY PROBLEMS AND POLITICAL WILL CAN BUILD BIKE LANES…
- So how do we change political will?
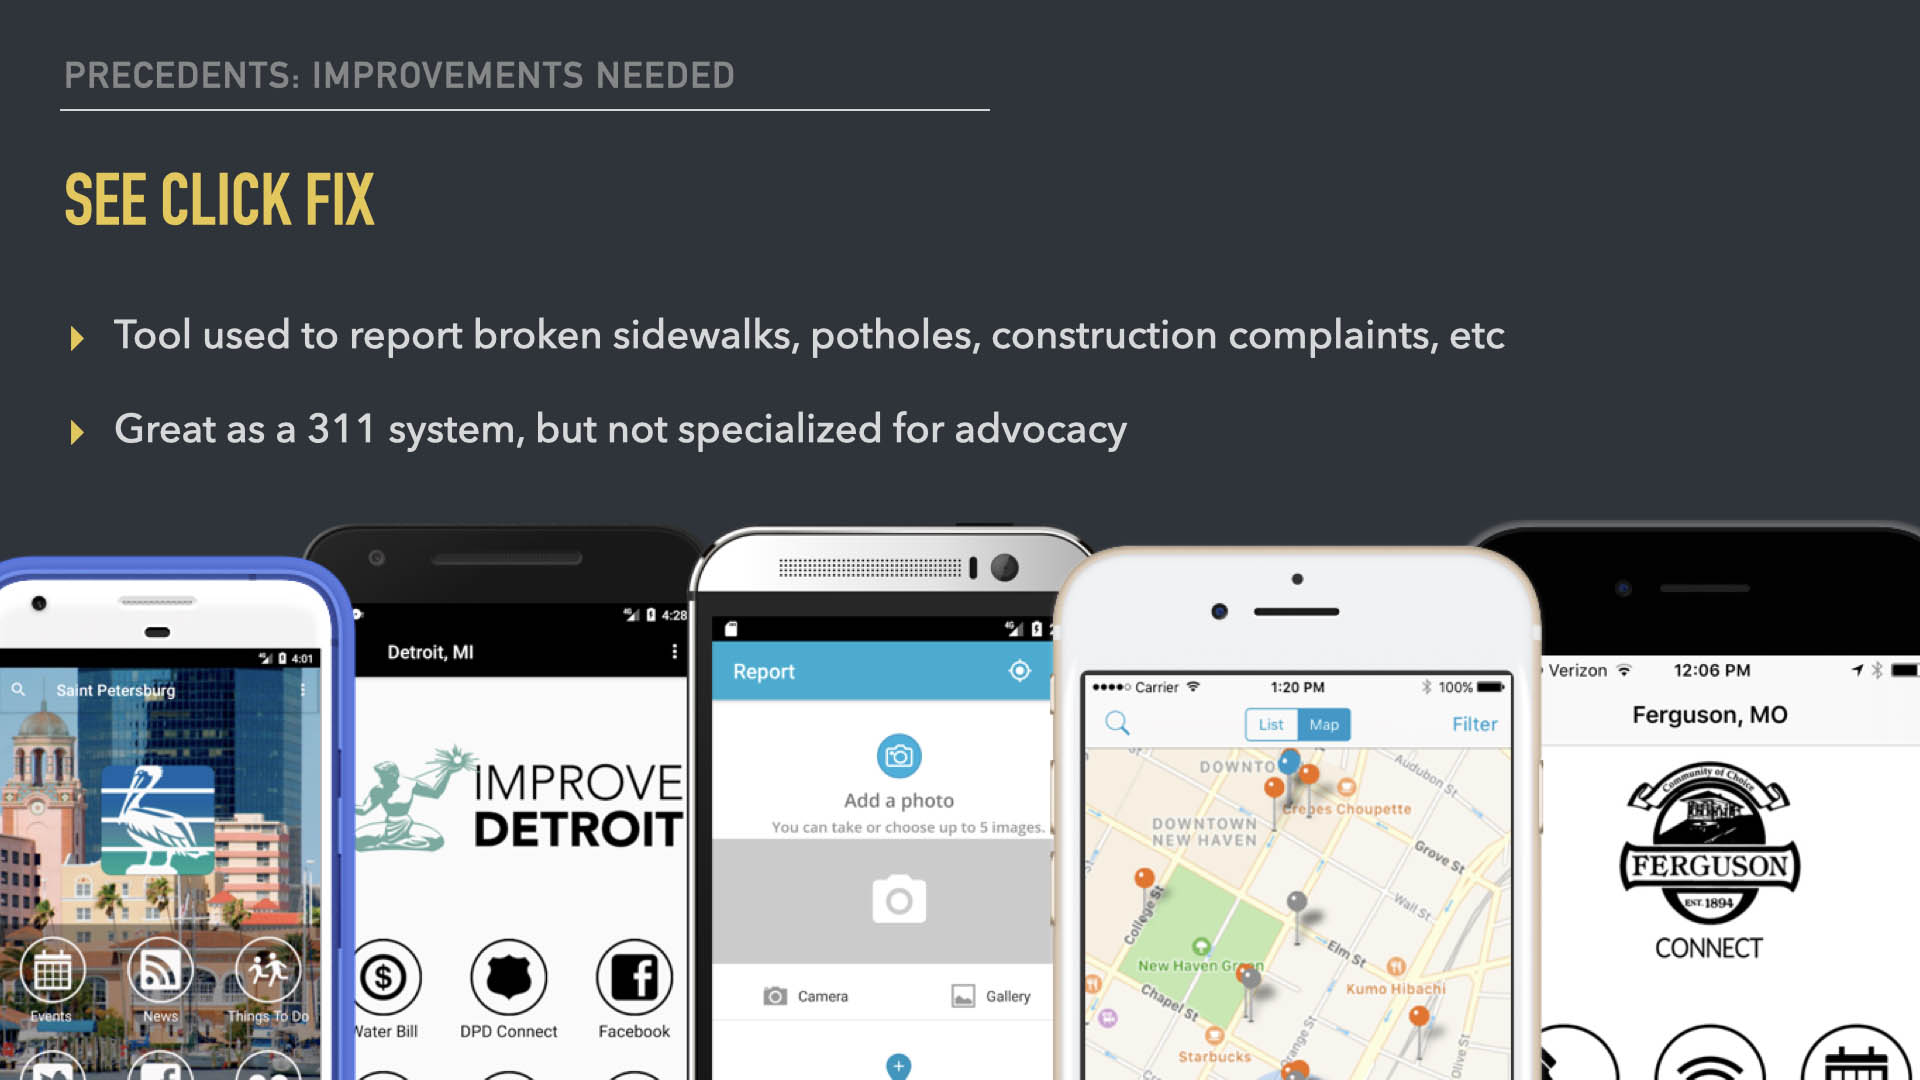
- So I looked at precedents for how to build better road infrastructure
- I found precedents in two areas: One is reporting and ratings
- For tasks that are straight forward and out of compliance
- But not useful for advocacy
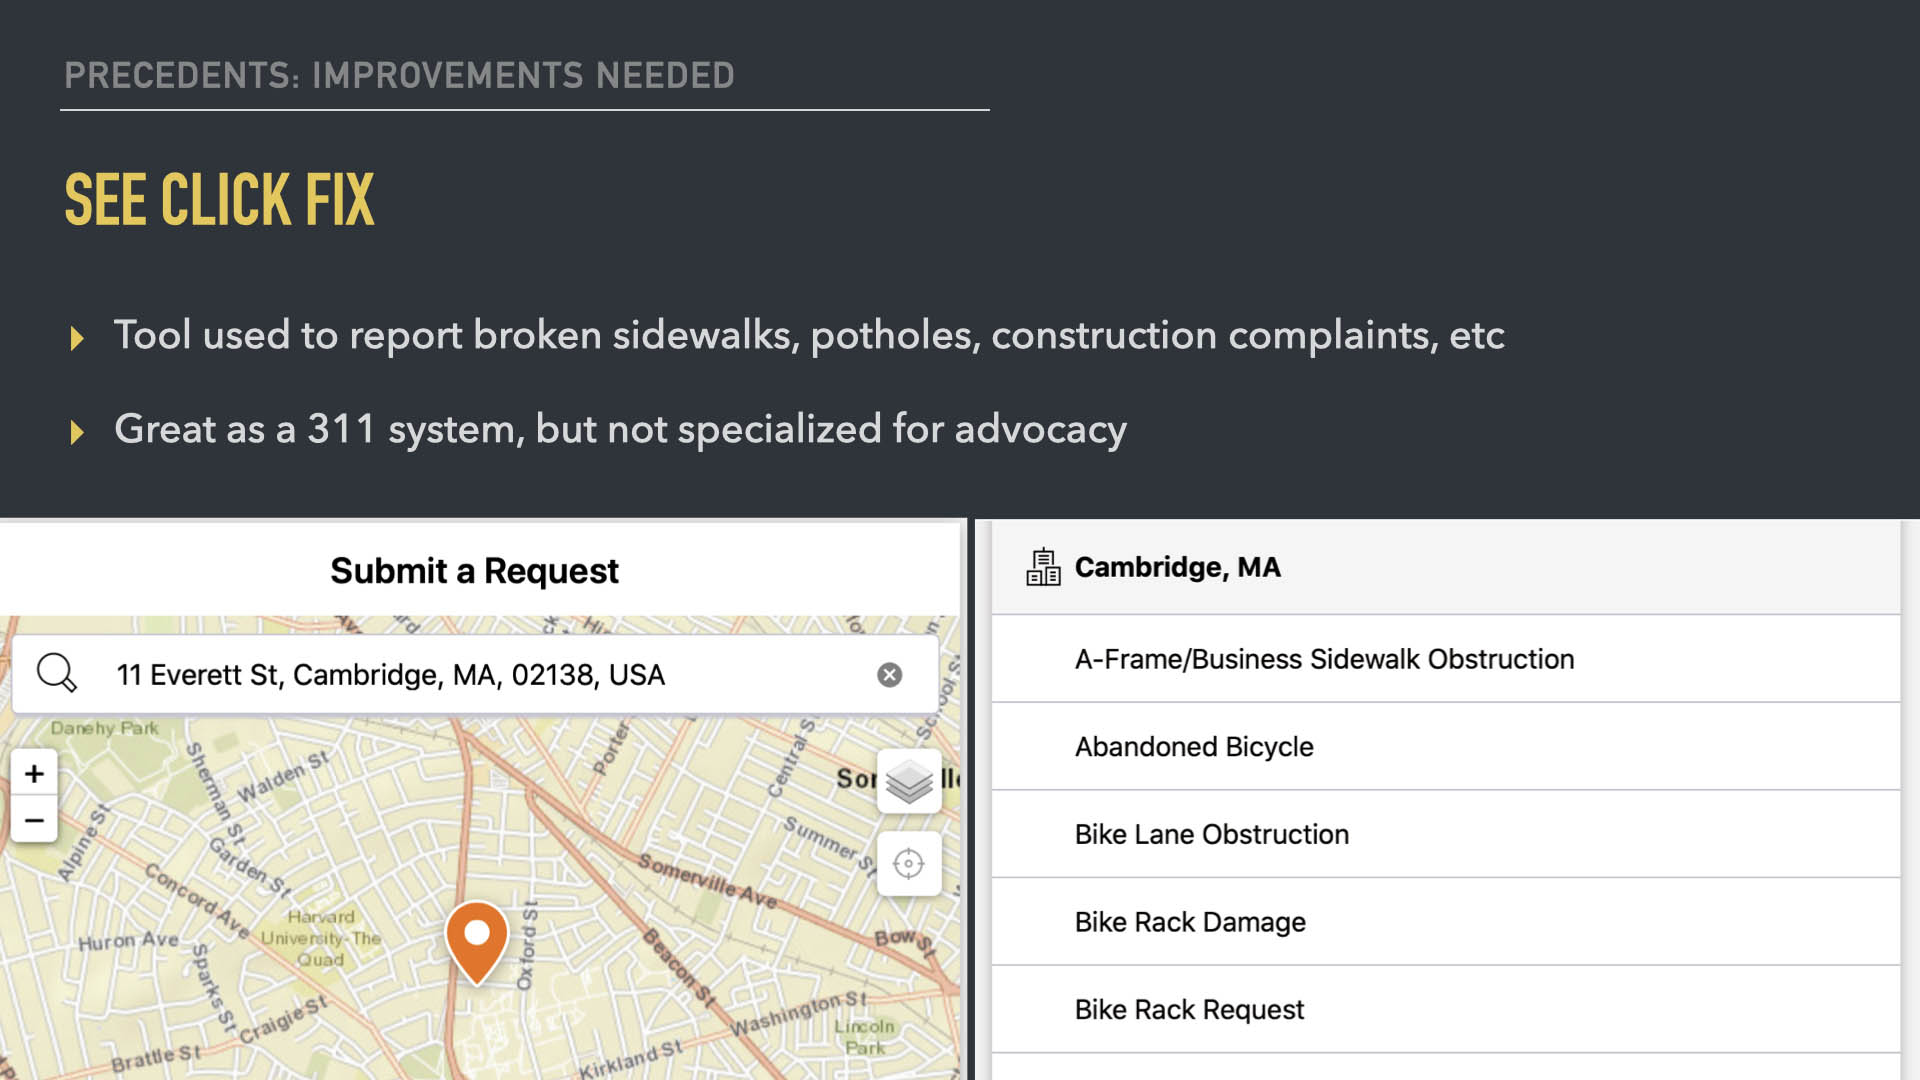
- You can report bike lane damage but not get new bike lanes put in
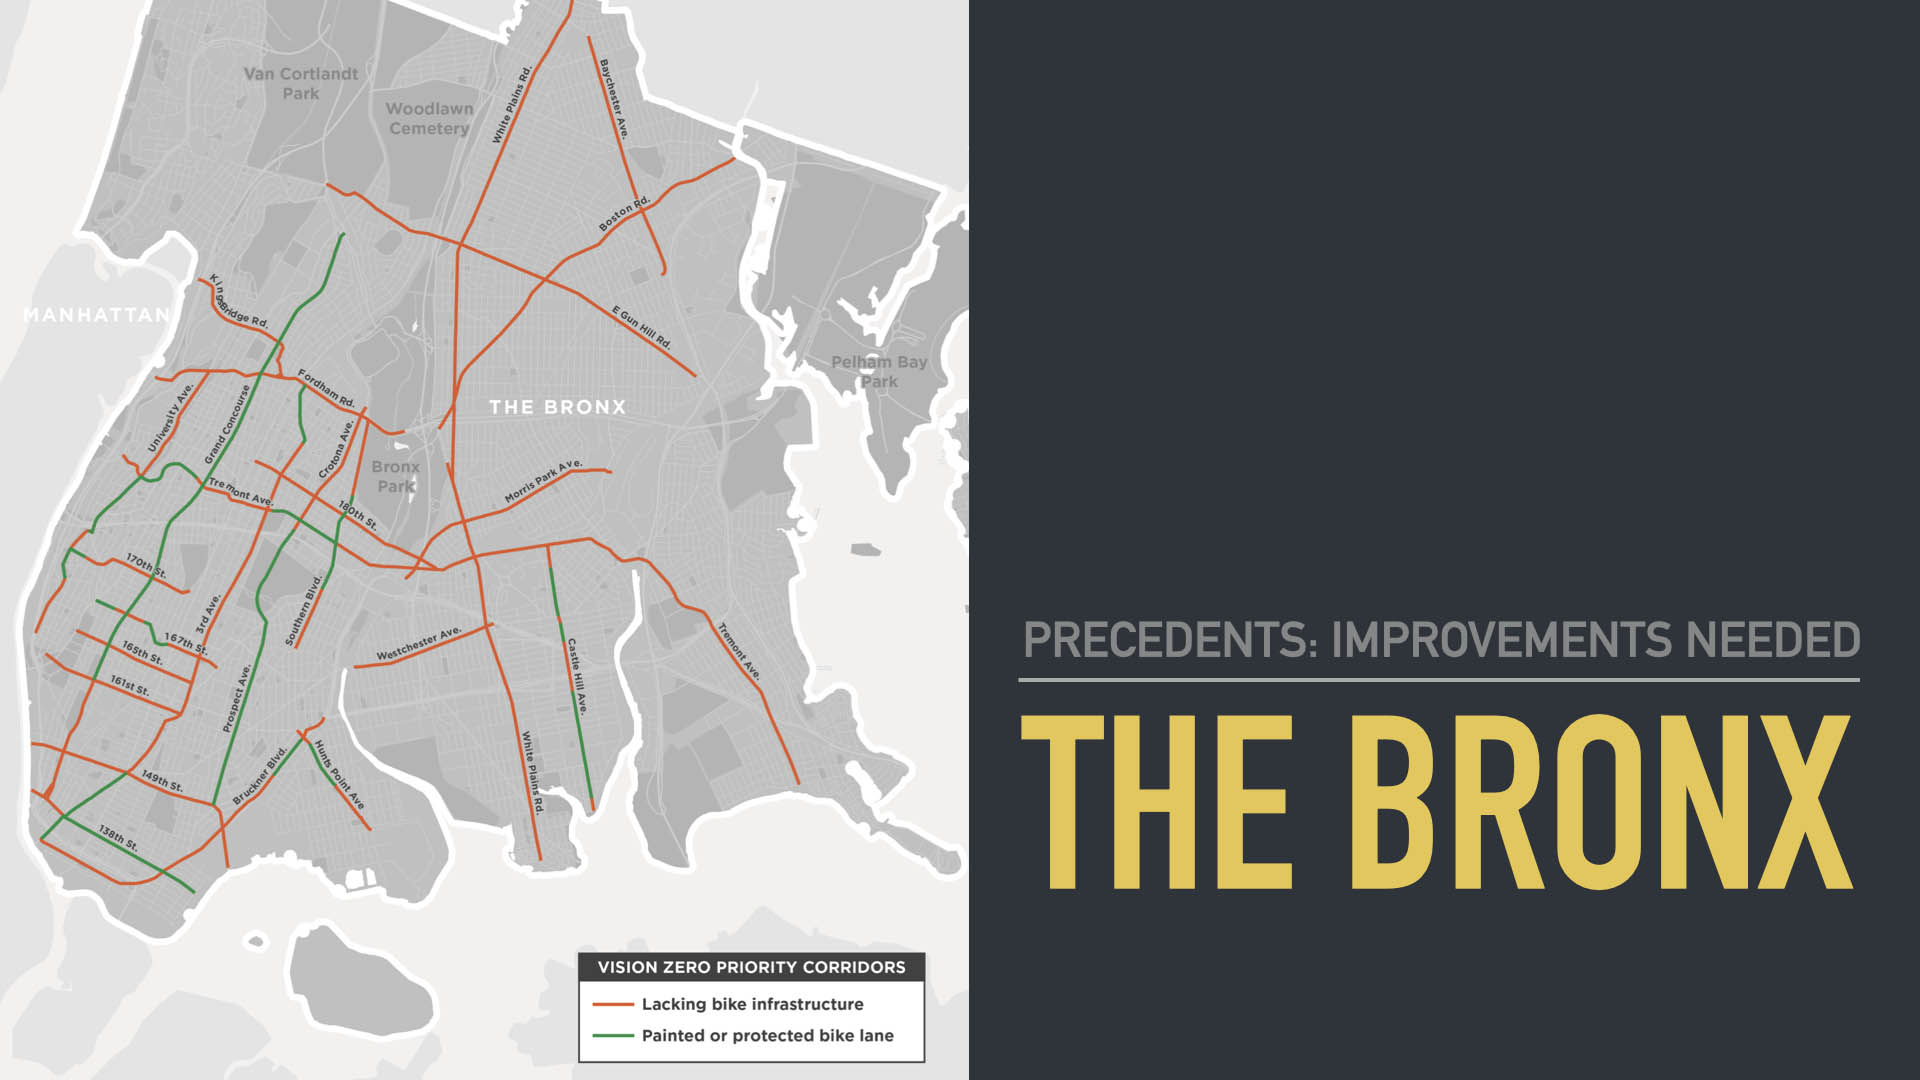
- Here is a wishlist out of NYC Vision Zero
- Marking the priority corridors that are without bike lanes
- Important to note that the little green there is for both painted and protected bike lanes
- Problem with maps like this is that they are non-specific about WHY to build
- There’s no call to action here
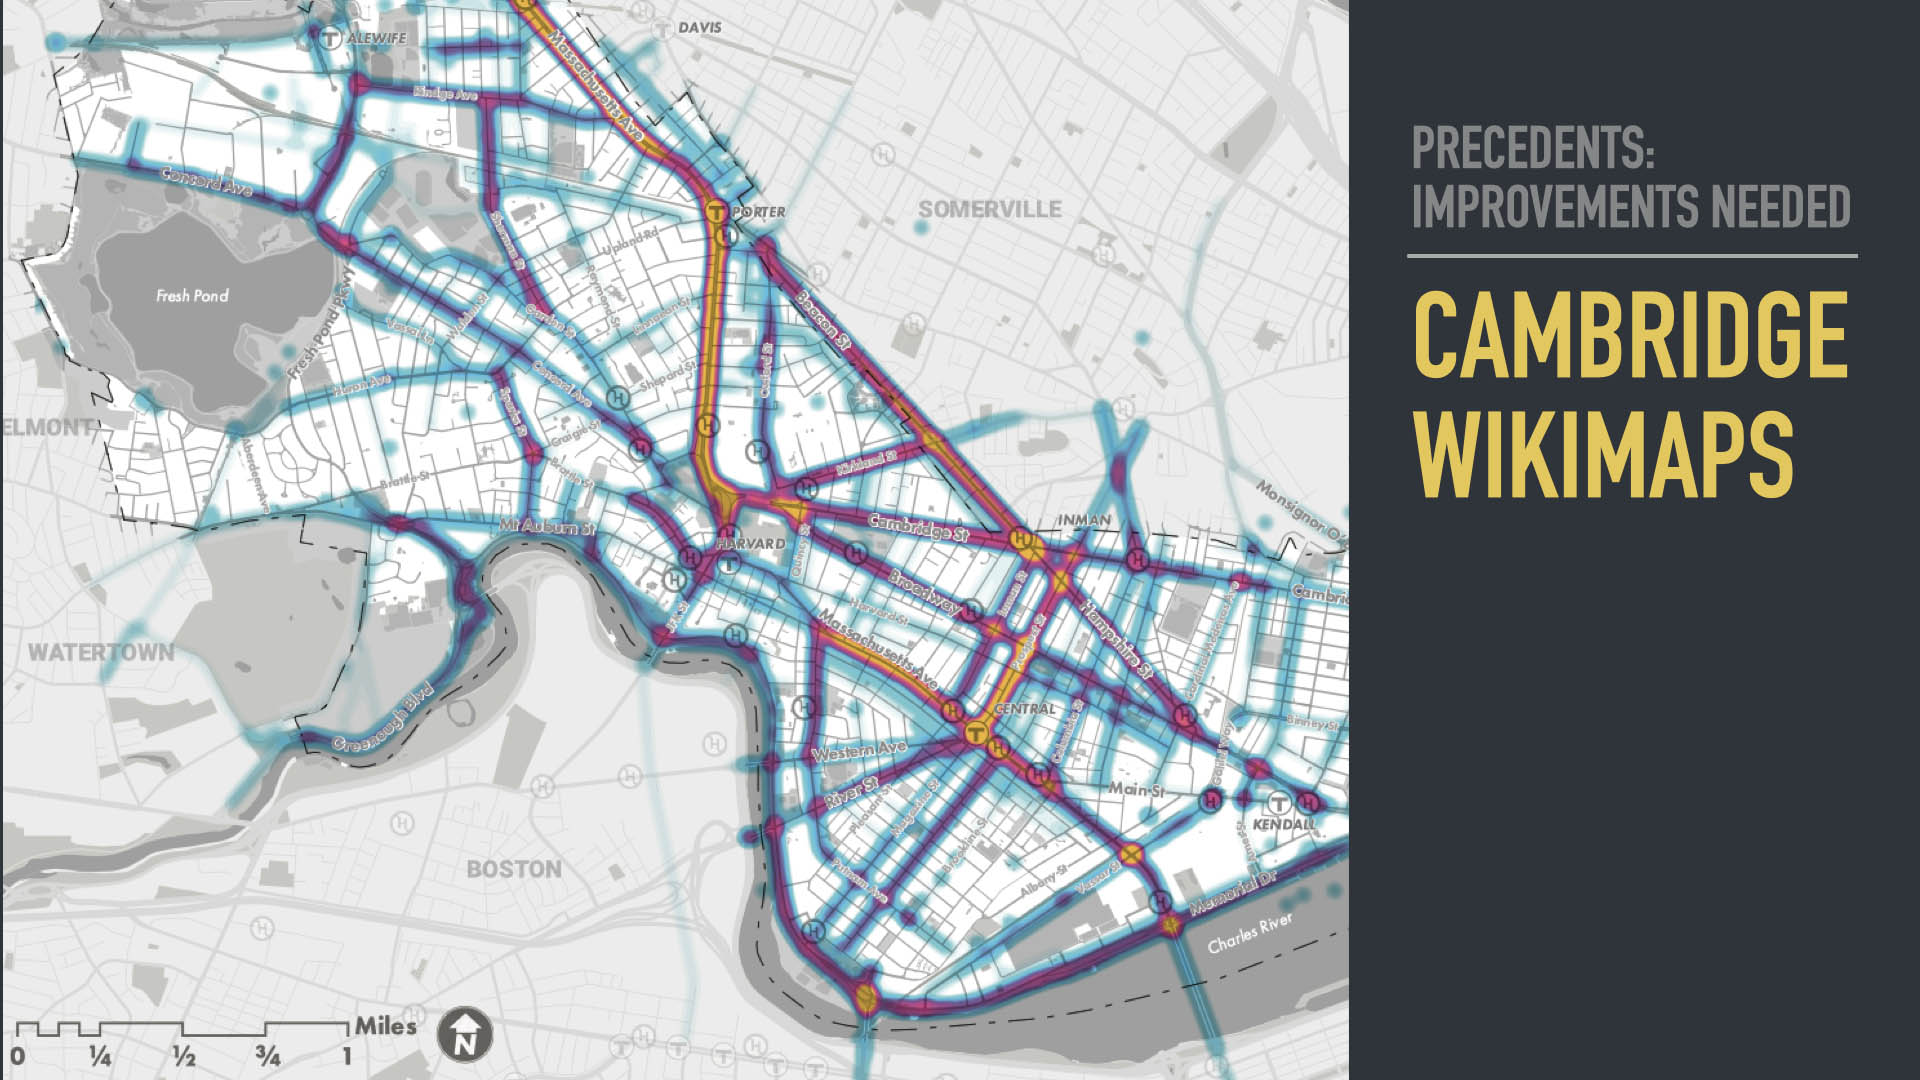
- You’re looking at a heat map of comments offered by about a thousand people
- Density map of commute popularity
- Nothing about wikimaps/seeclickfix surprises me about what needs to be improved
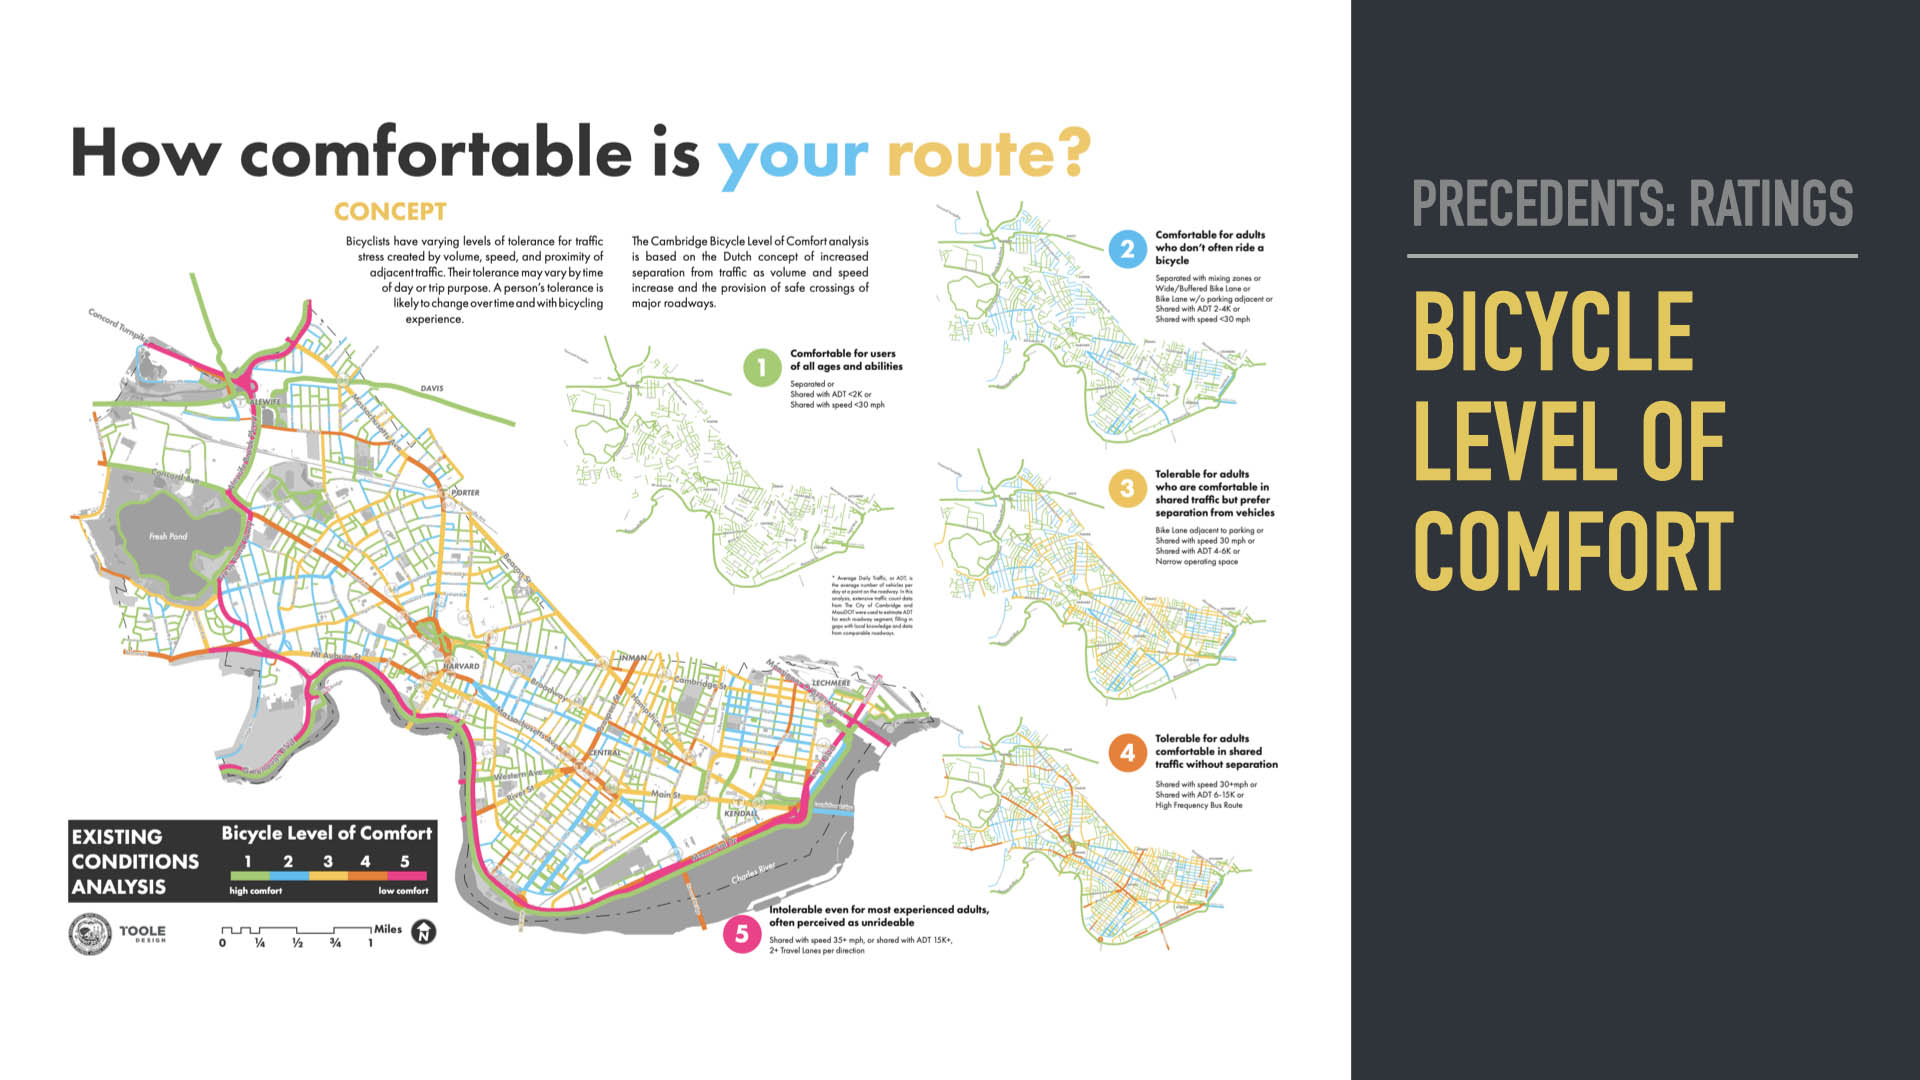
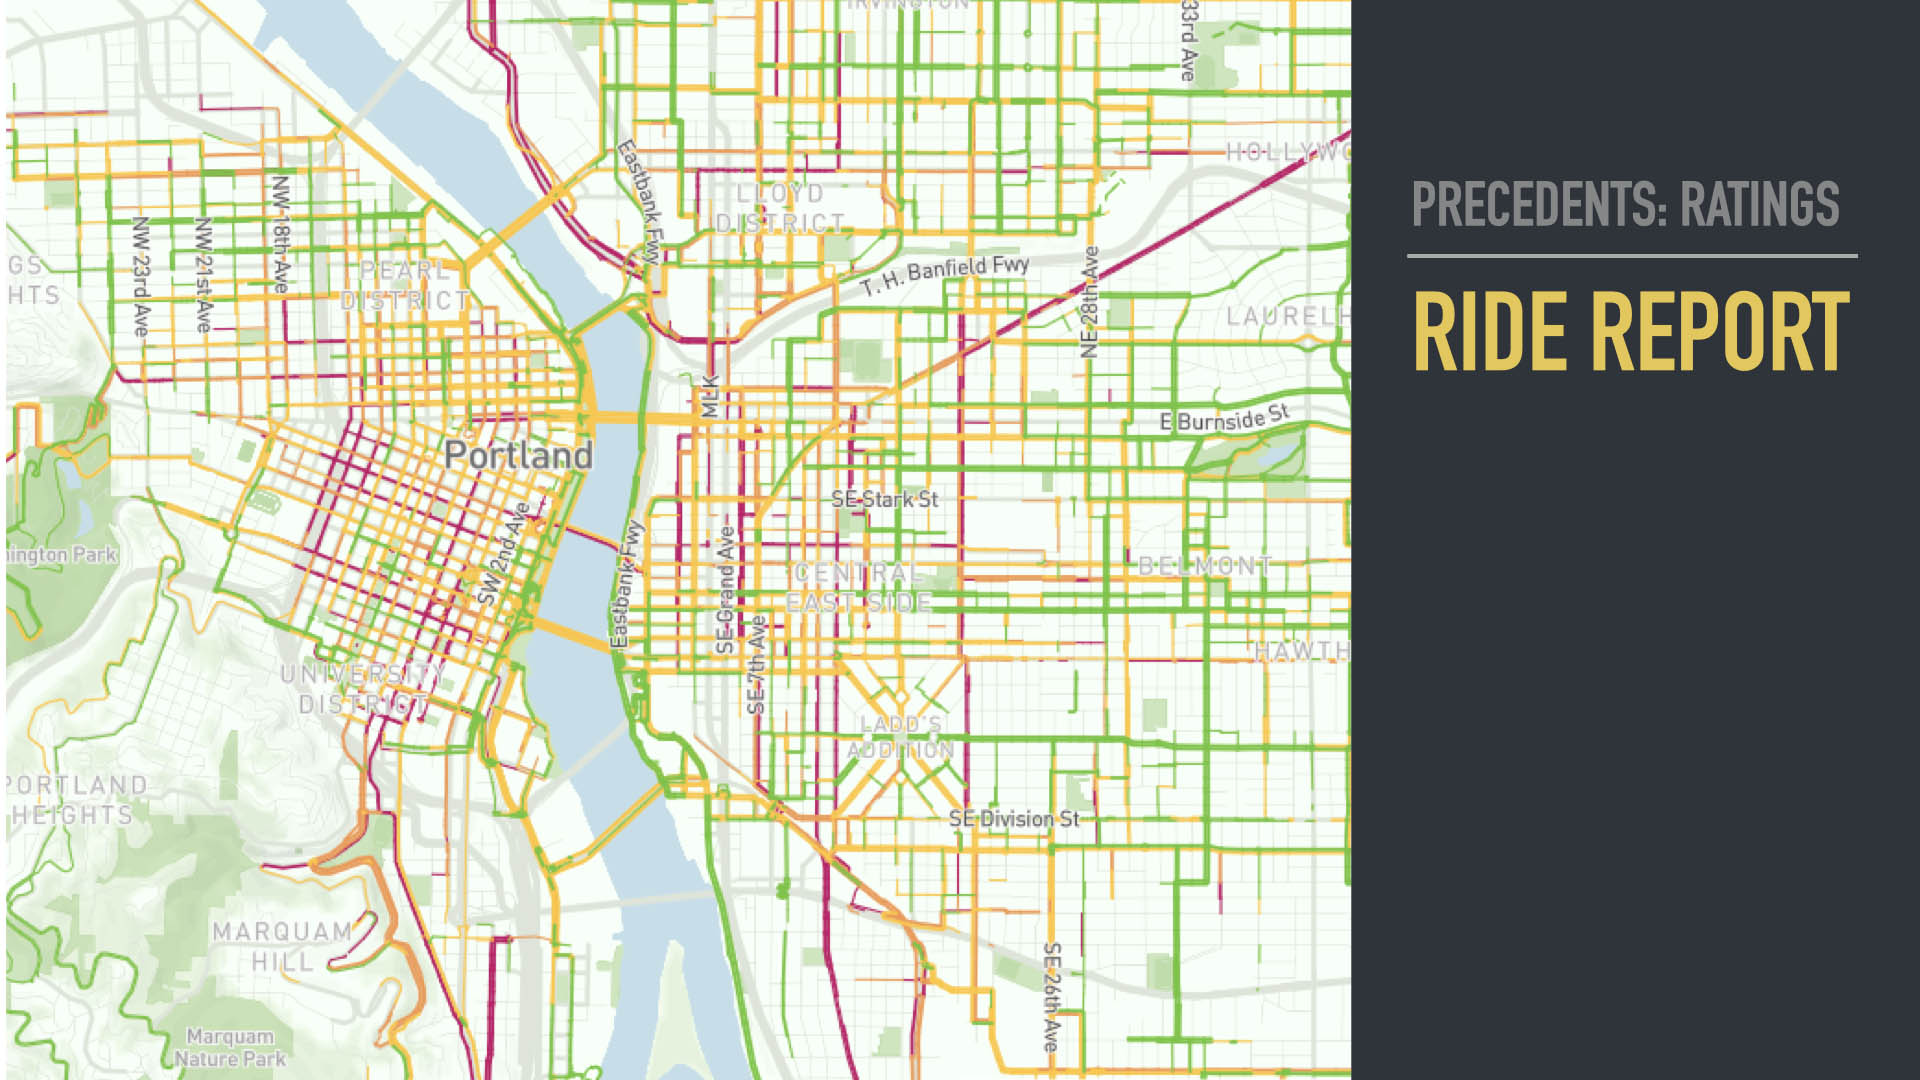
- Let’s look at the bike lanes we do have and figure out how useful they are
- The issue is no call too action, and it doesn’t make a case
- That’s really because it’s developed with a more objective method, LTS scores
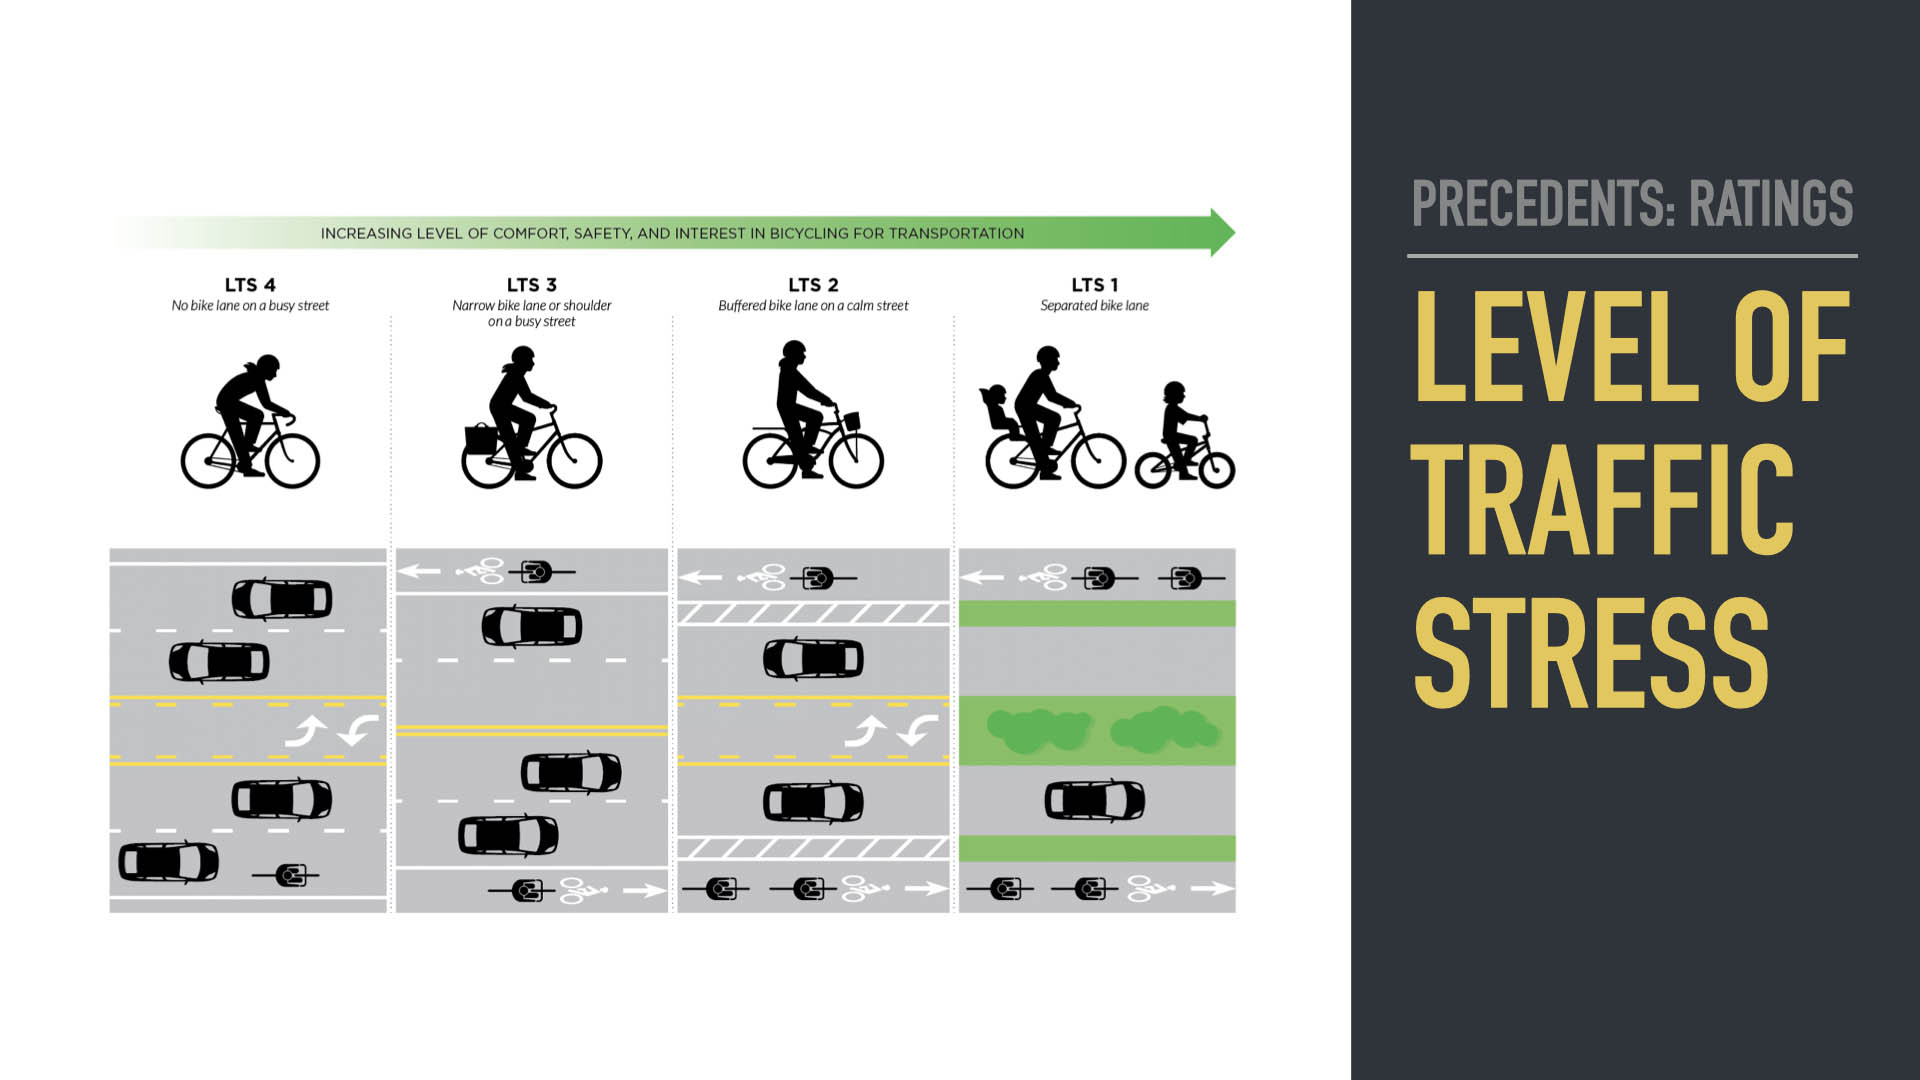
- These are objective measurements about the road that result in a rating
- Inputs are based on posted and observed speed limits, presence and width of bikeways, traffic volumes, and gaps in the network
- Plus, the Data is subject to availability and thoroughness of travel data
- But LTS aren’t 1:1 with actual comfort
- And they don’t account for a number of factors that turns a good street into a harrowing street
- Automatic comfort levels drawn from phone accelerometer data and user ratings
- It’s great, but it doesn’t take into account temporary obstructions (UPS truck in the bike lane)
- And no open data, can’t remix and contribute outside of a private app
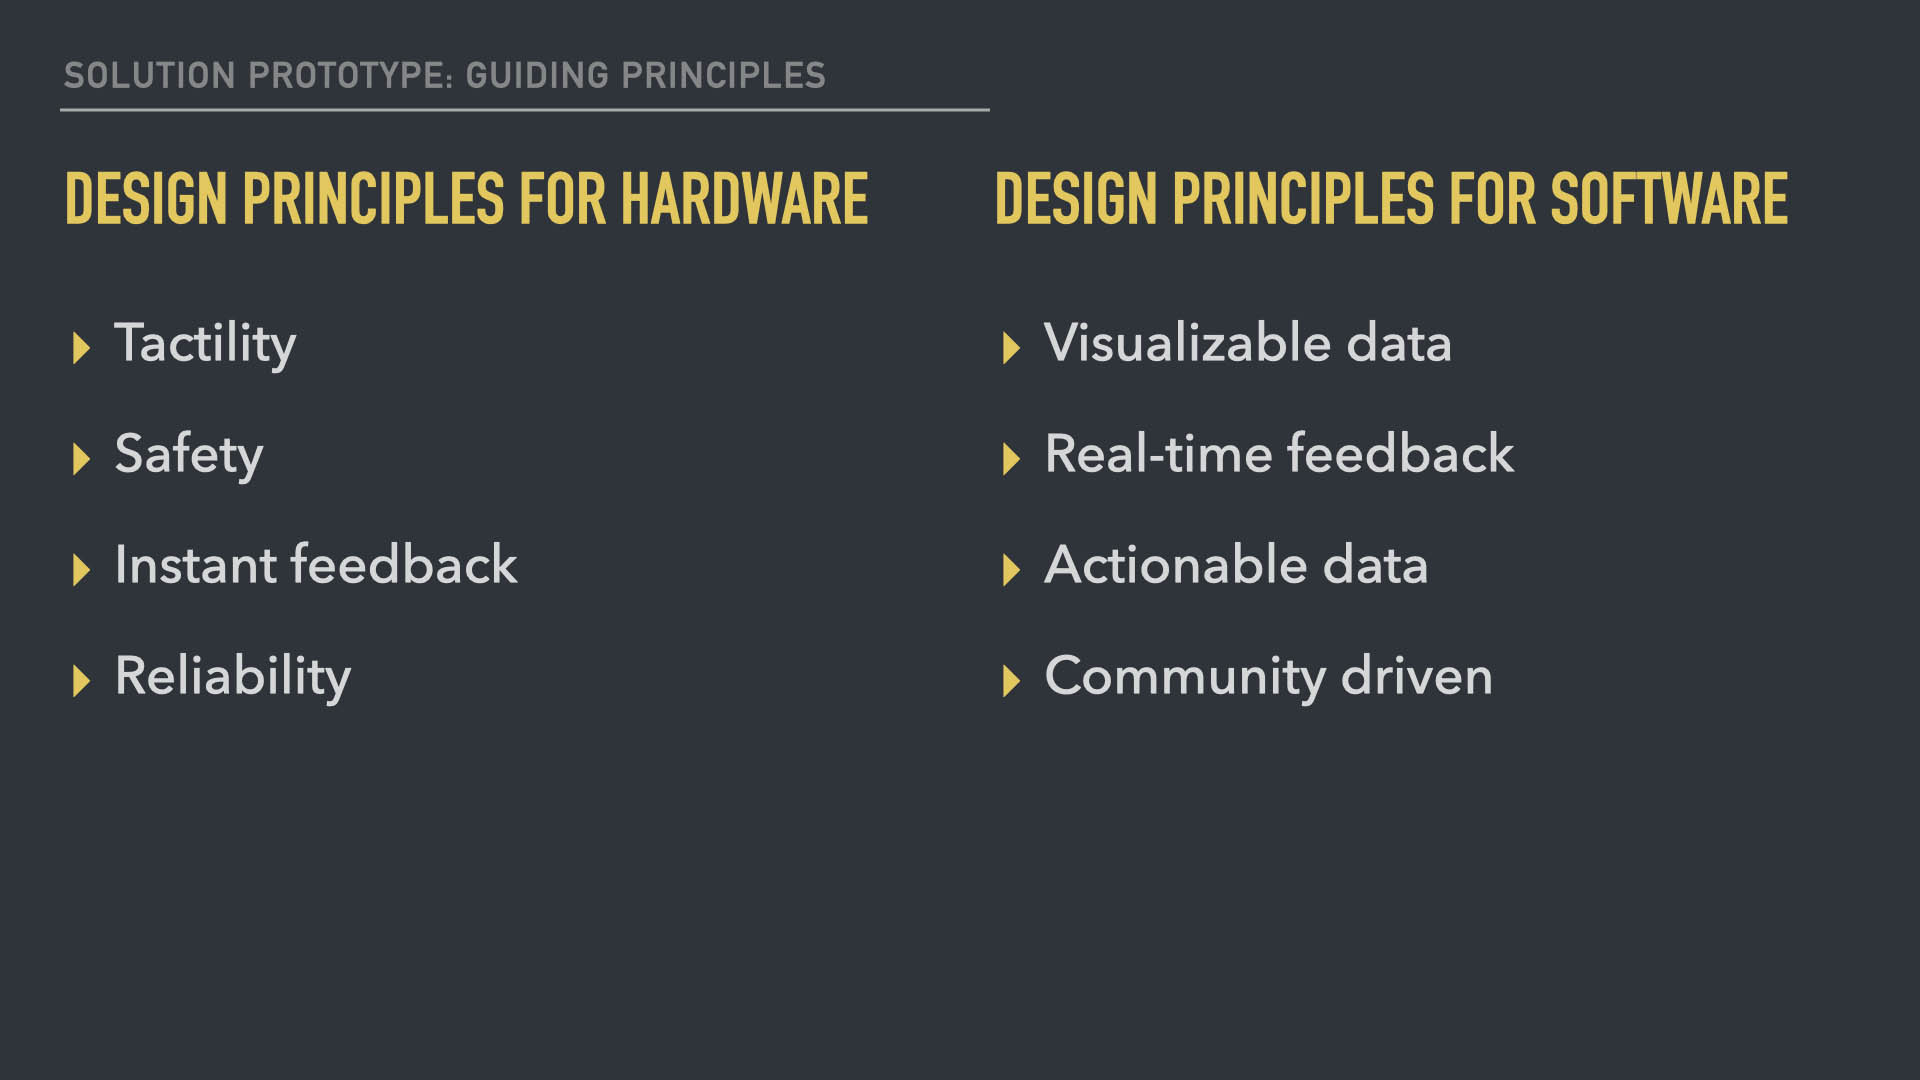
- So I noodled on all of those comfort maps and developed a system of design principles for what I would ultimately make
- I knew I wanted to make a hardware/software combination
Hardware
- Tactility and Safety are about being easy to rate without looking at a phone
- Instant feedback so the system was transparent
- Reliability so you can set it and forget it, it just works
Software
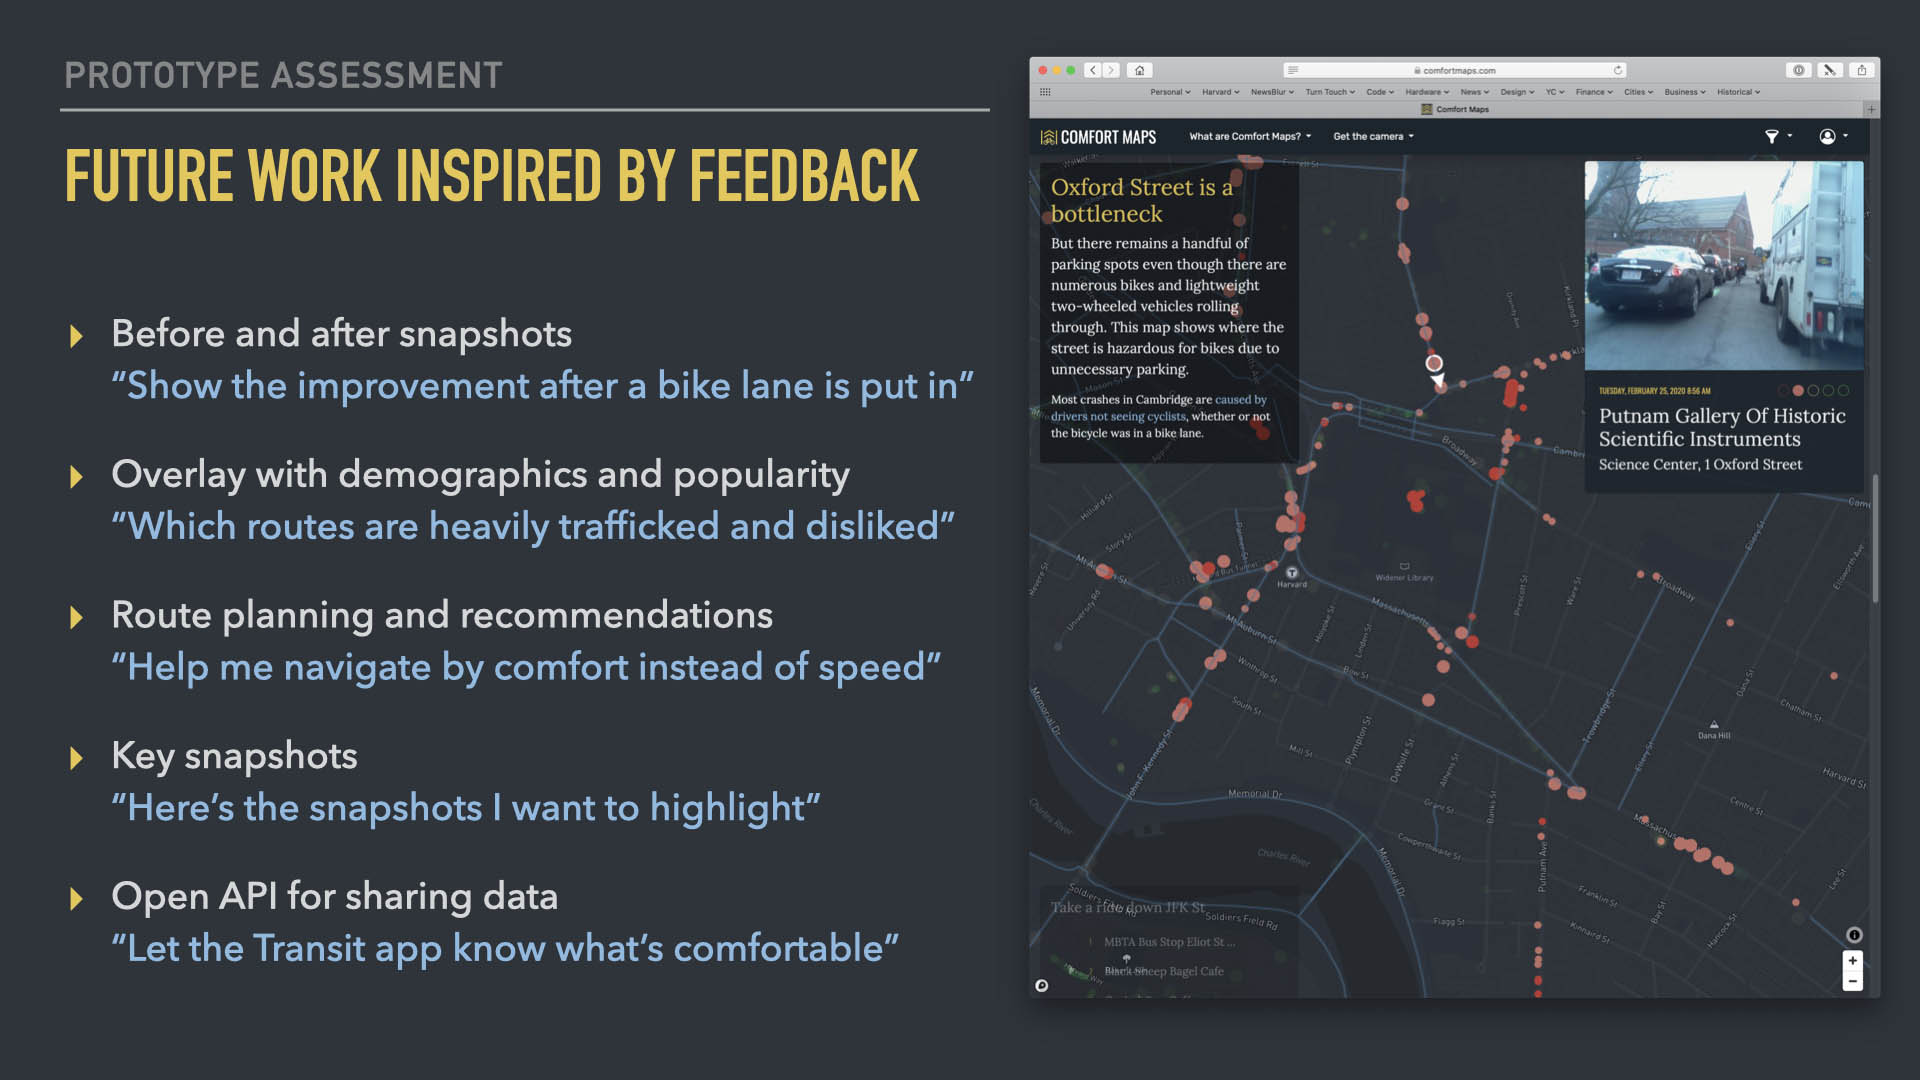
- Visualizable data to tell better stories
- Real-time feedback so you can tell that story without waiting on anybody
- Actionable data means having a call to action
- Community driven so data is bottom up, not top down
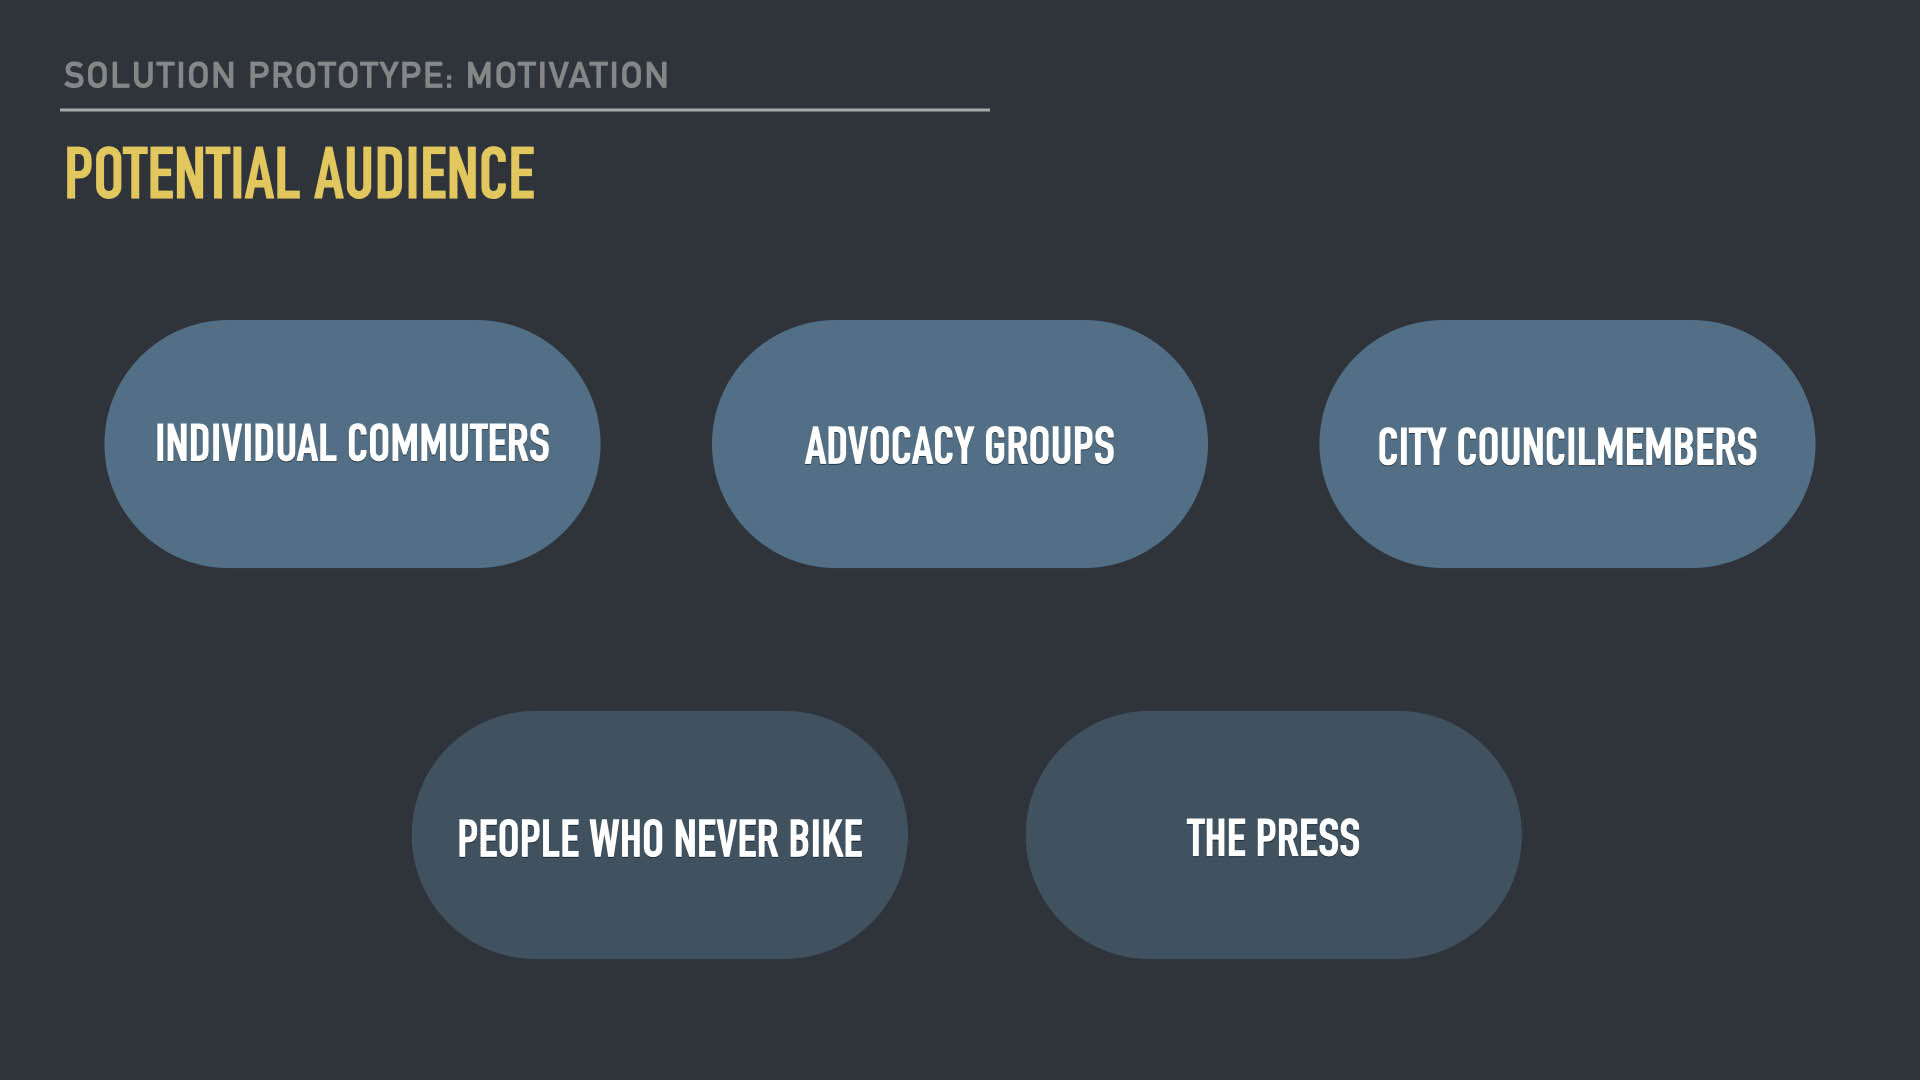
Individual commuters:
- People like you and me who want to fix the gaps on their own commute
Advocacy groups:
- And their ability to mobilize groups of commuters to advocate for bike lanes
City Councilmembers:
- Politicians who want to understand better the road conditions and how to prioritize funding
People who never bike:
- For people who are maybe Cycle-curious
- Show experience on the street
Press:
- This is who you tell your story to, keeping in mind why they should care
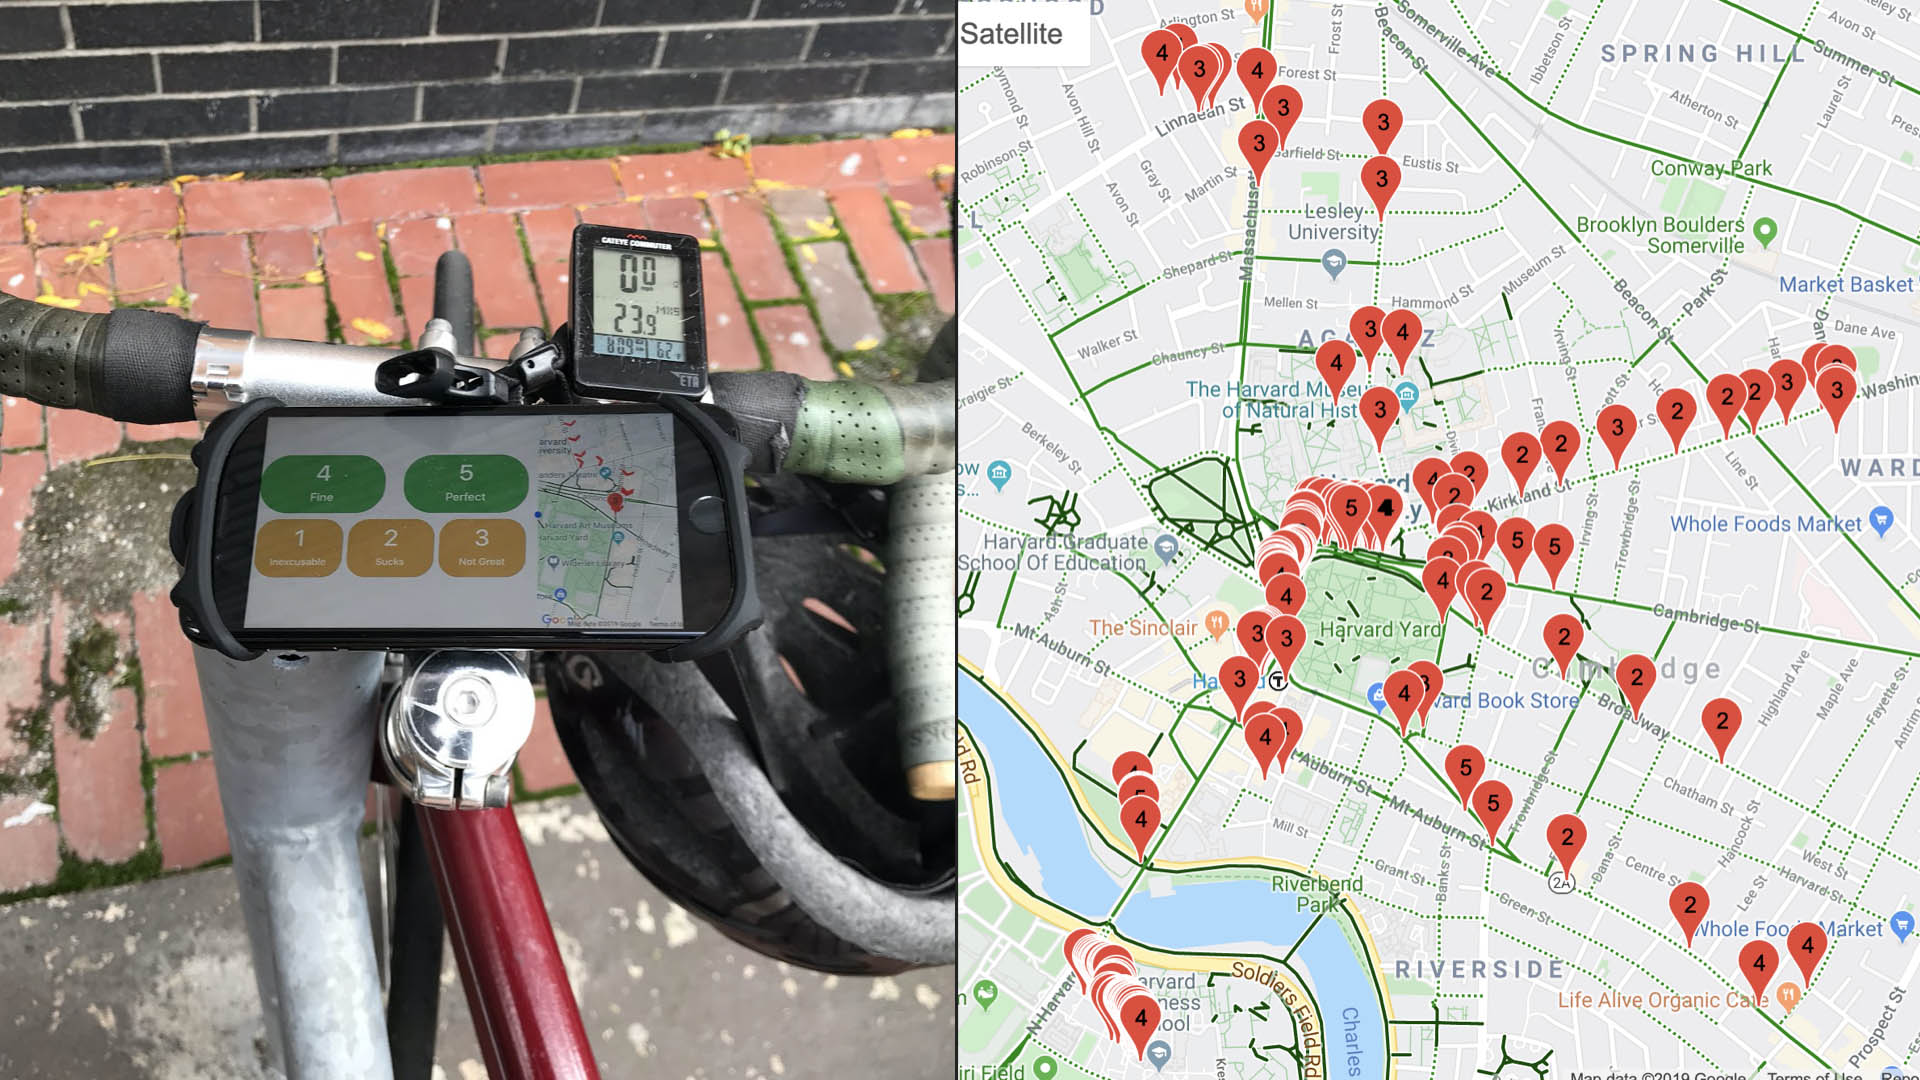
- So I ran an experiment
- 6 people, 300 snapshots in a single afternoon
- This is subjective but quantified data
- 1 is Inexcusable, 2 is Sucks, 3 is Not Great, 4 is Fine, 5 is Perfect
- And I thought, you know what this needs: A camera
- I want to know how you distinguish a 4 from a 5
- And I wanted to know what is normally a 5 suddenly turns to a 2 and what makes it go bad

- So I designed built and codified the hardware
- First the board using Eagle
- Minted the boards
- Soldered them on that dining room table
- And then designed and assembled a device
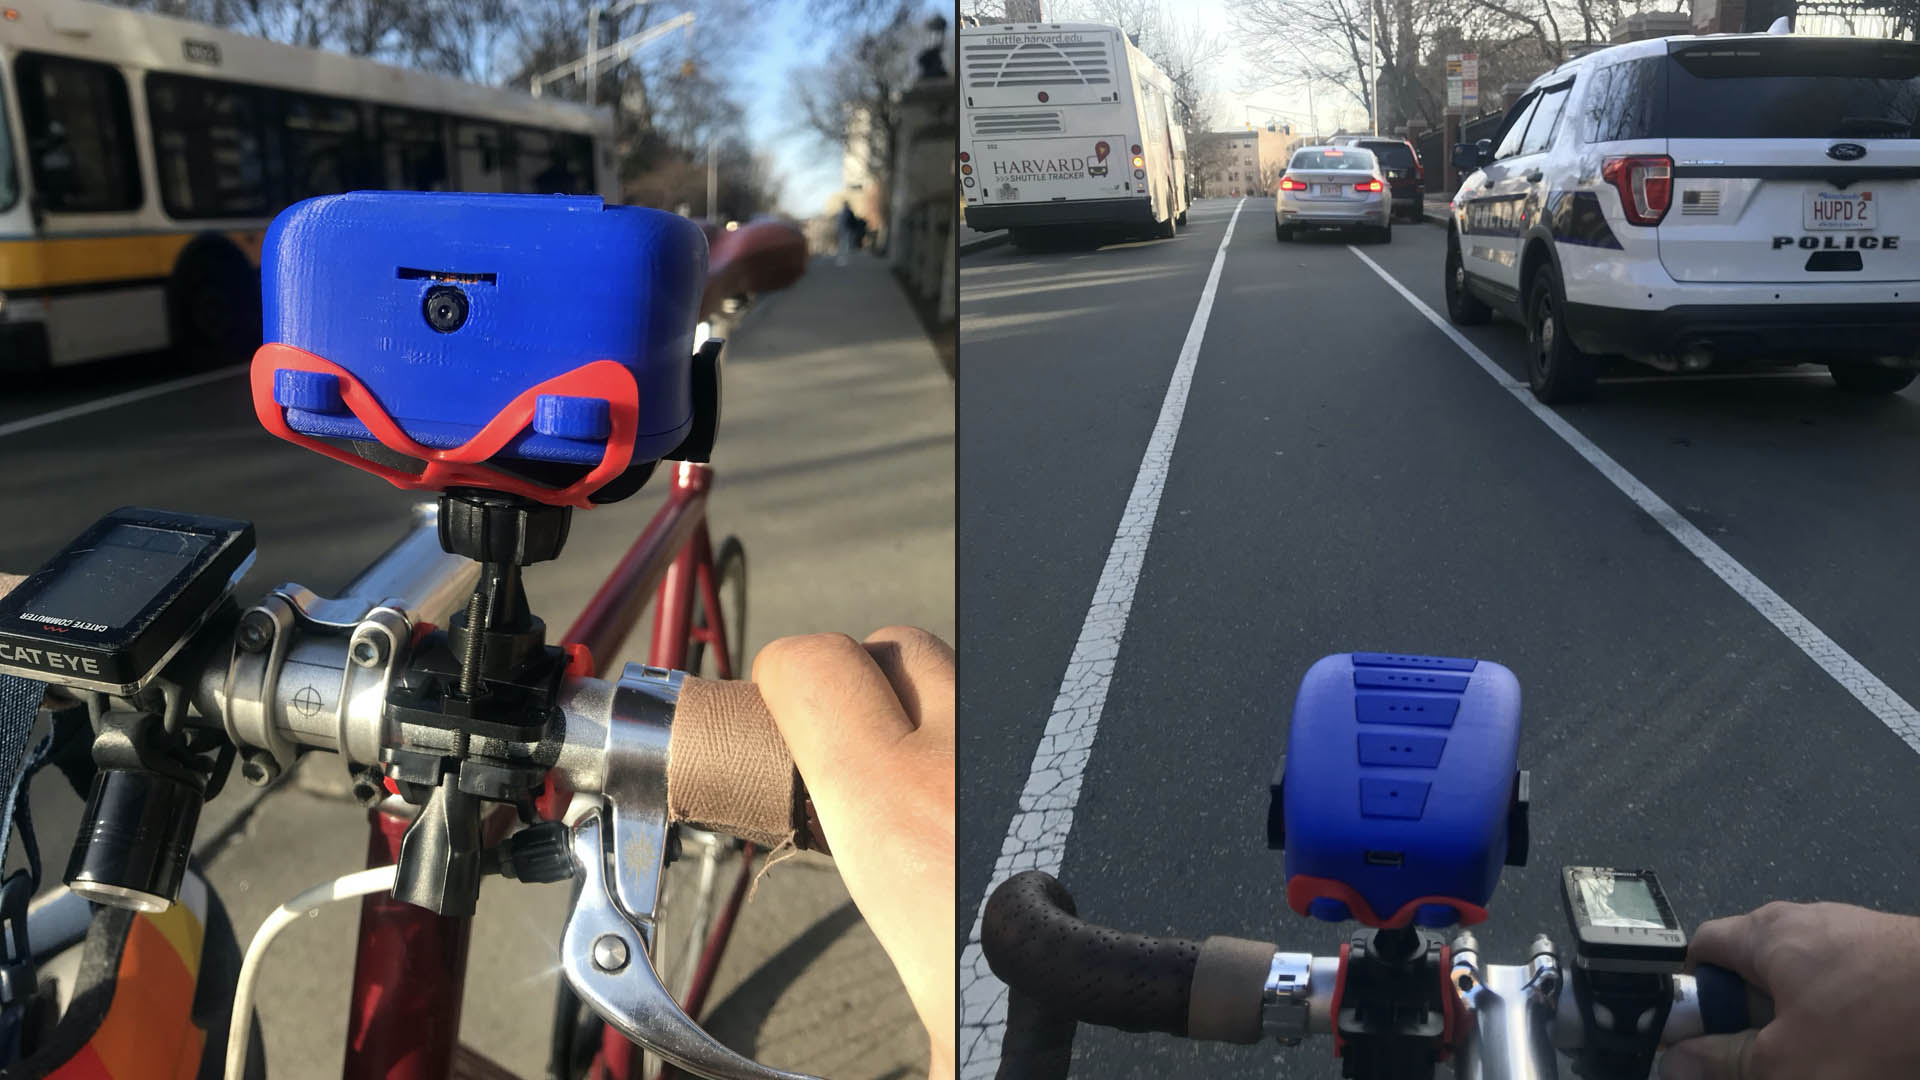
- Five buttons and a camera
- Straps to your handlebars
- Got a low power IMU that puts it to sleep when not in use, and it tells you to charge it once a month
- Features atomic uploading, so it’s smart about uploading to both save power and work in different conditions
- Idea is that you can now capture those sticky situations
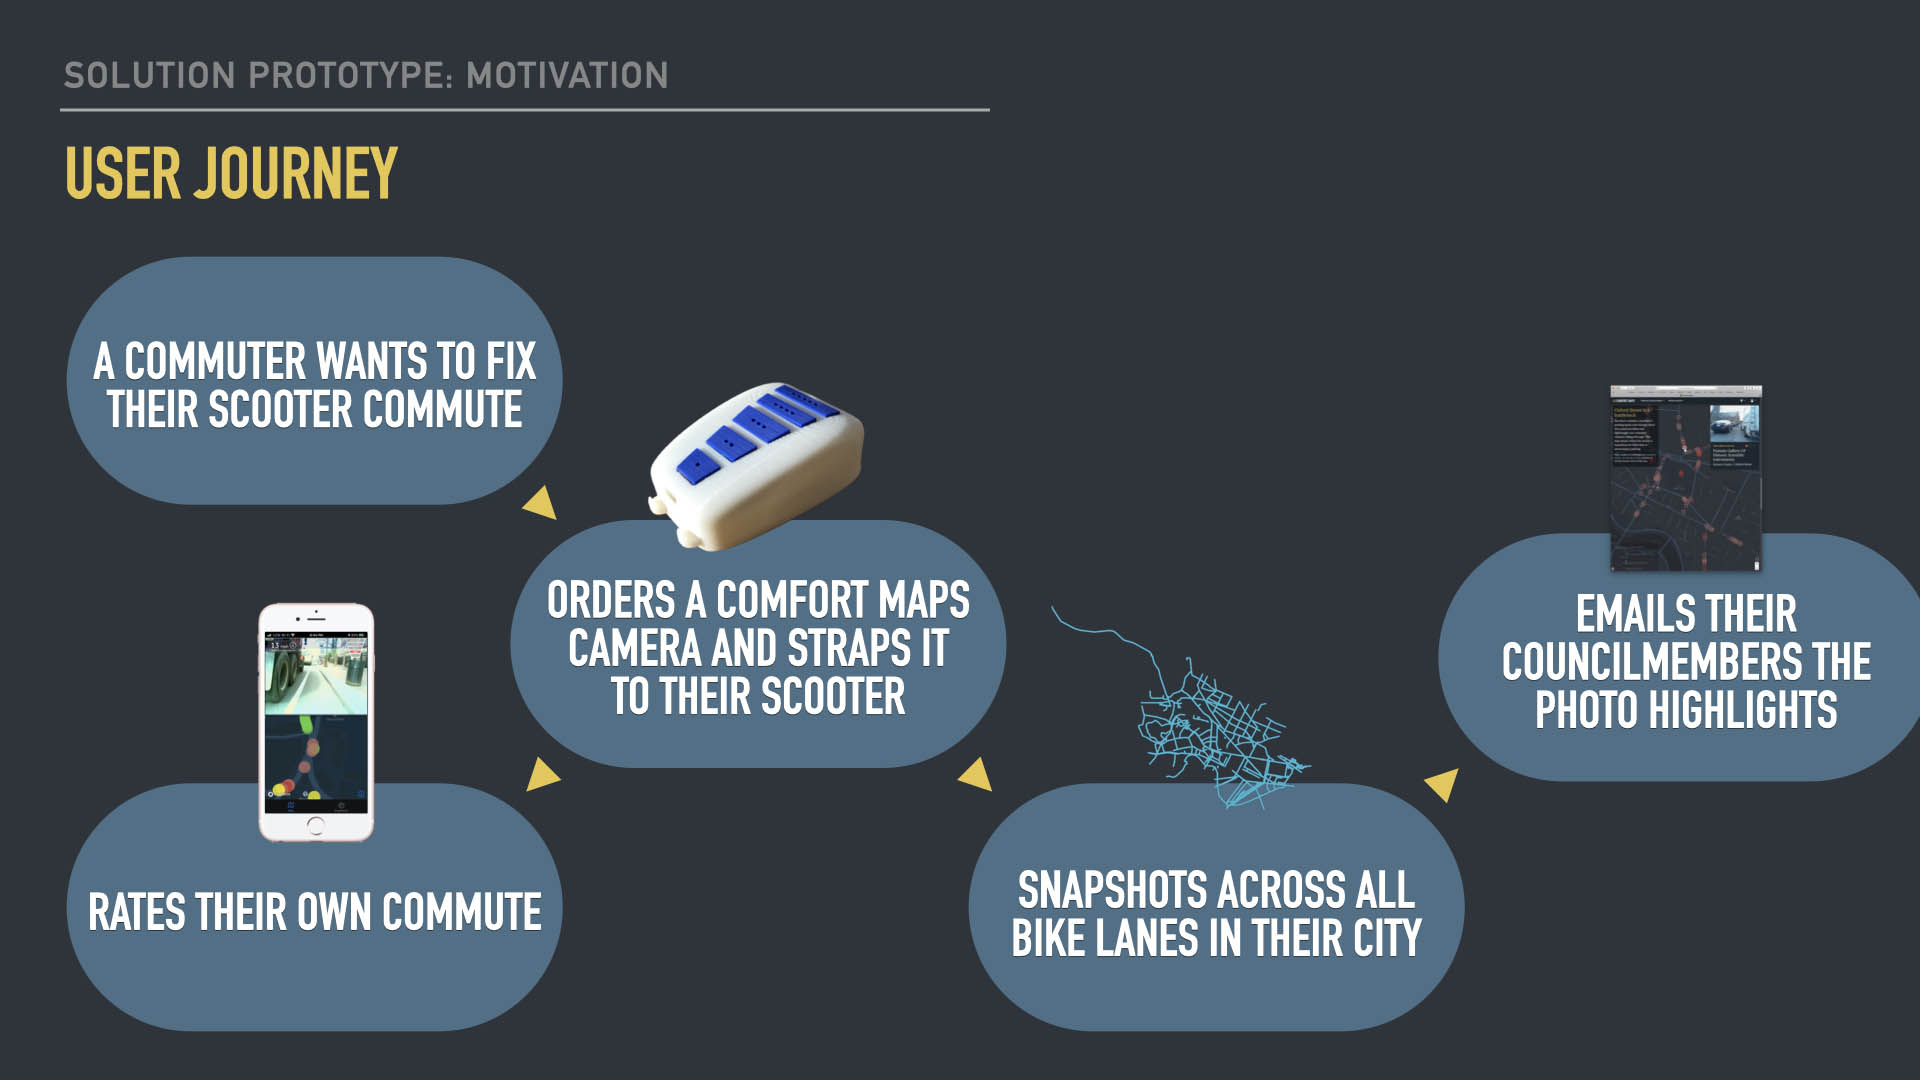
For Users, incentives are:
- Seamlessly participate in bike advocacy
- Make your commute route better by reporting infrastructures failures and dangerous bike lanes
- Rate their own commute: It’s a selfish need but that has a lot of incentive
Scaling up to system level, for everybody:
- Highlights where the infrastructure is inadequate and harmful
- Email your council members with snapshots to show the photo highlights and your lived experience
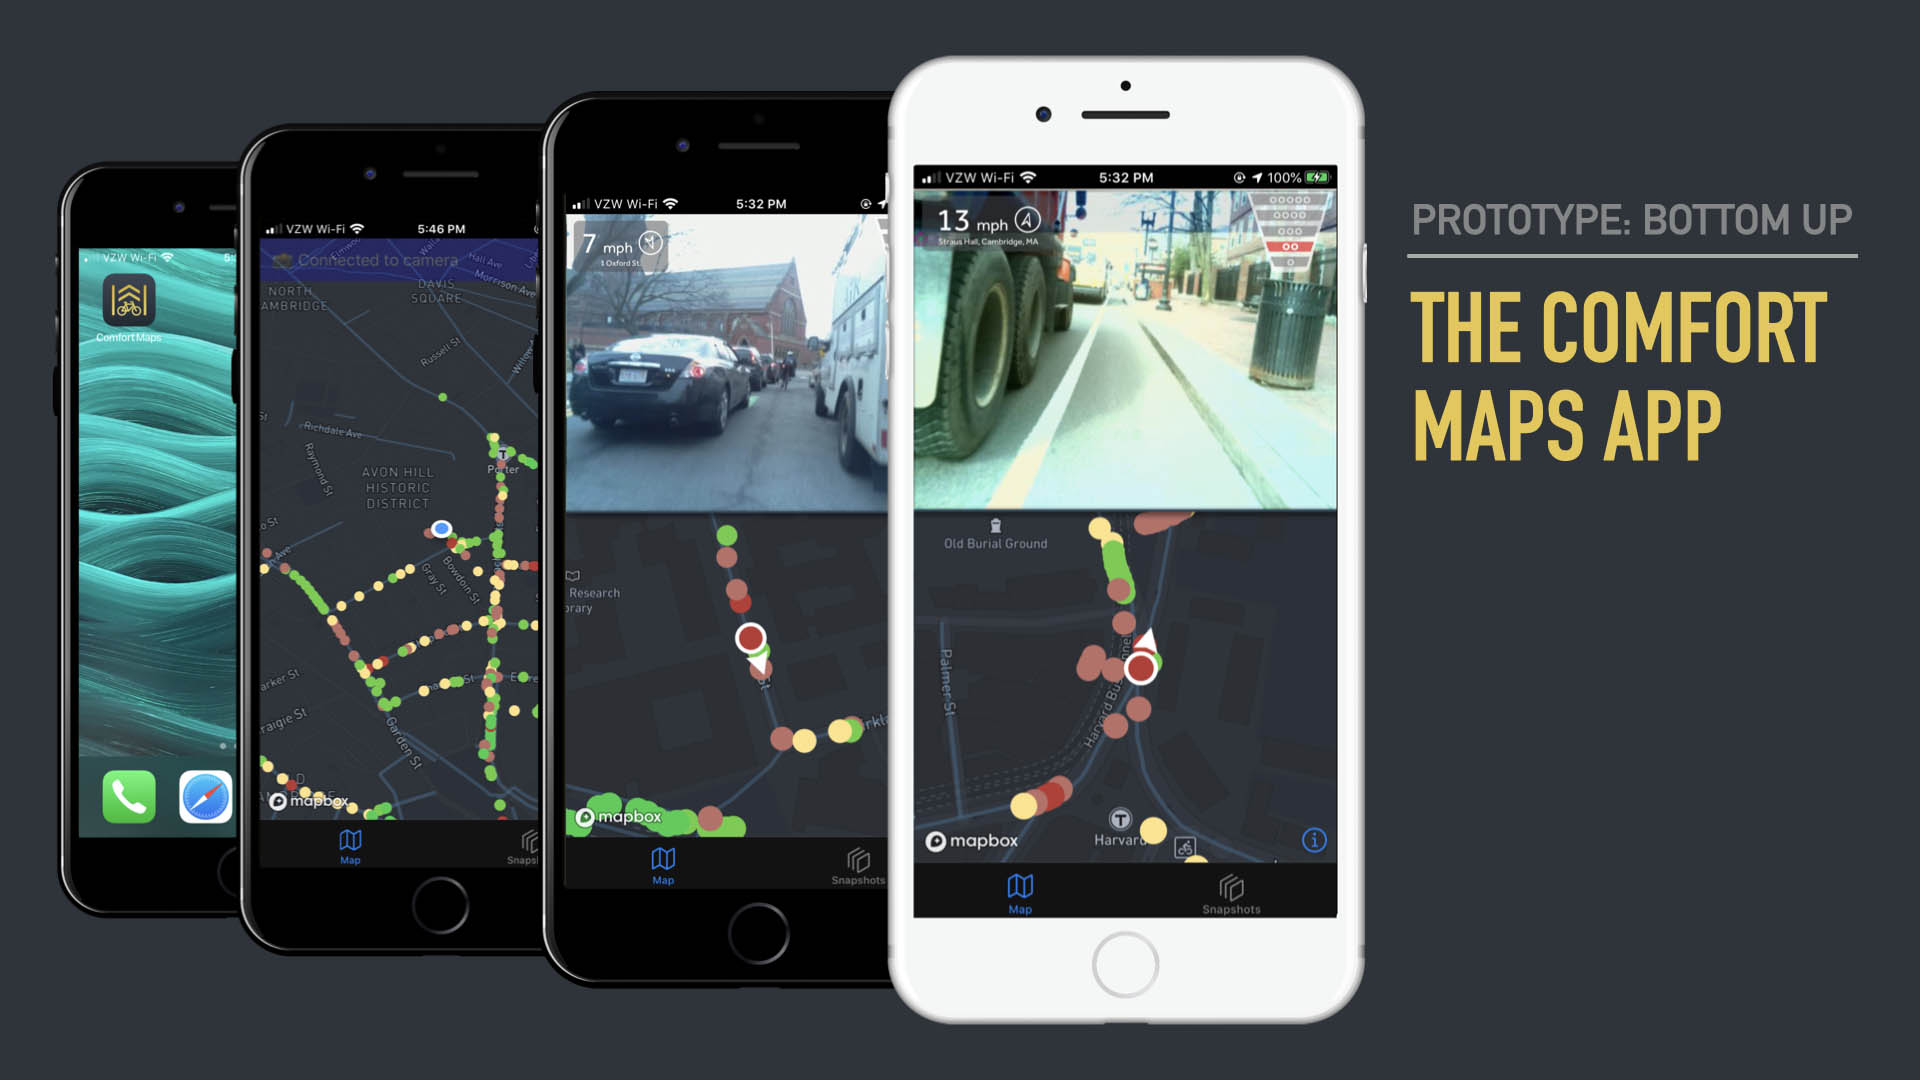
- So when you use the camera, you use it with the comfort maps app
- This provides a map with your snapshots and a map of routes needing updating and capturing
- It’s now easy to snapshot the sticky situations
- All over your city and your commute
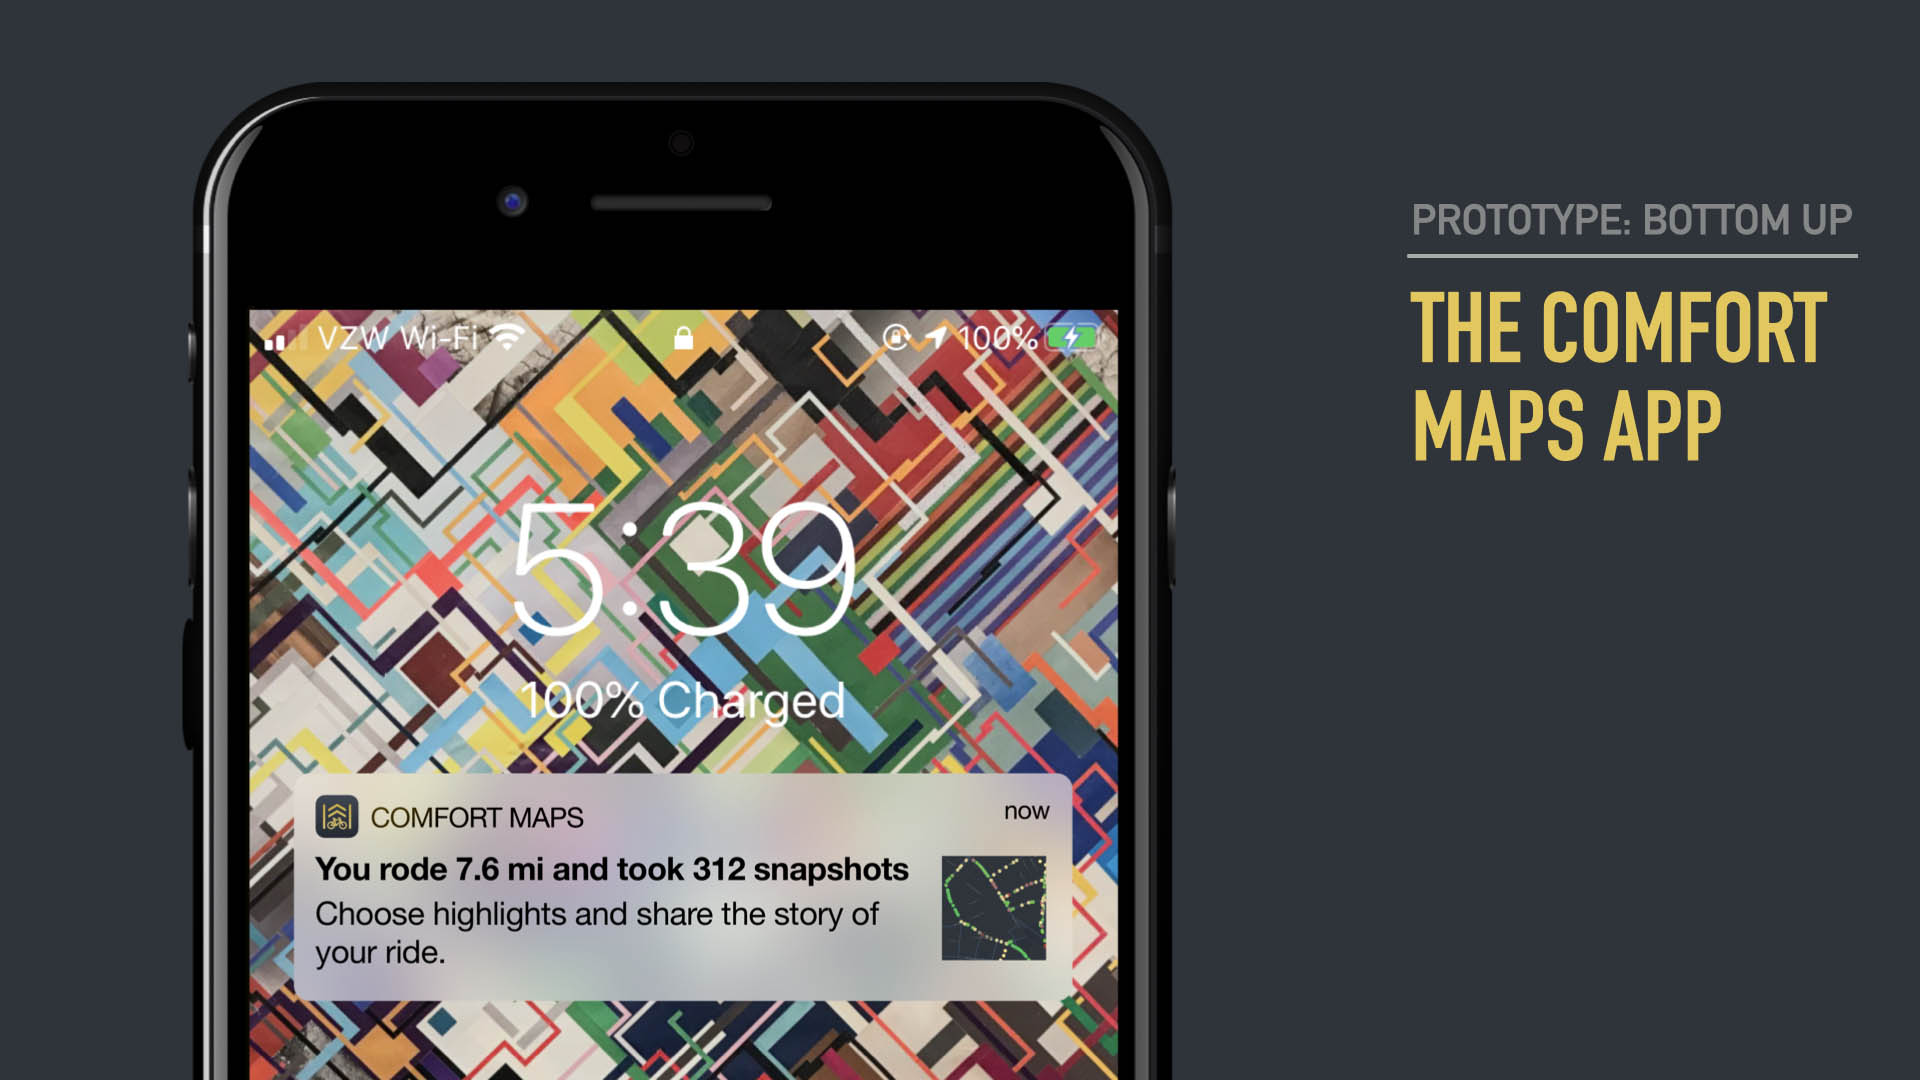
- Bring it full circle
- Once we have data we need to tell its story
- This notification closes the loop
- Advocacy groups can have teams and push out campaigns
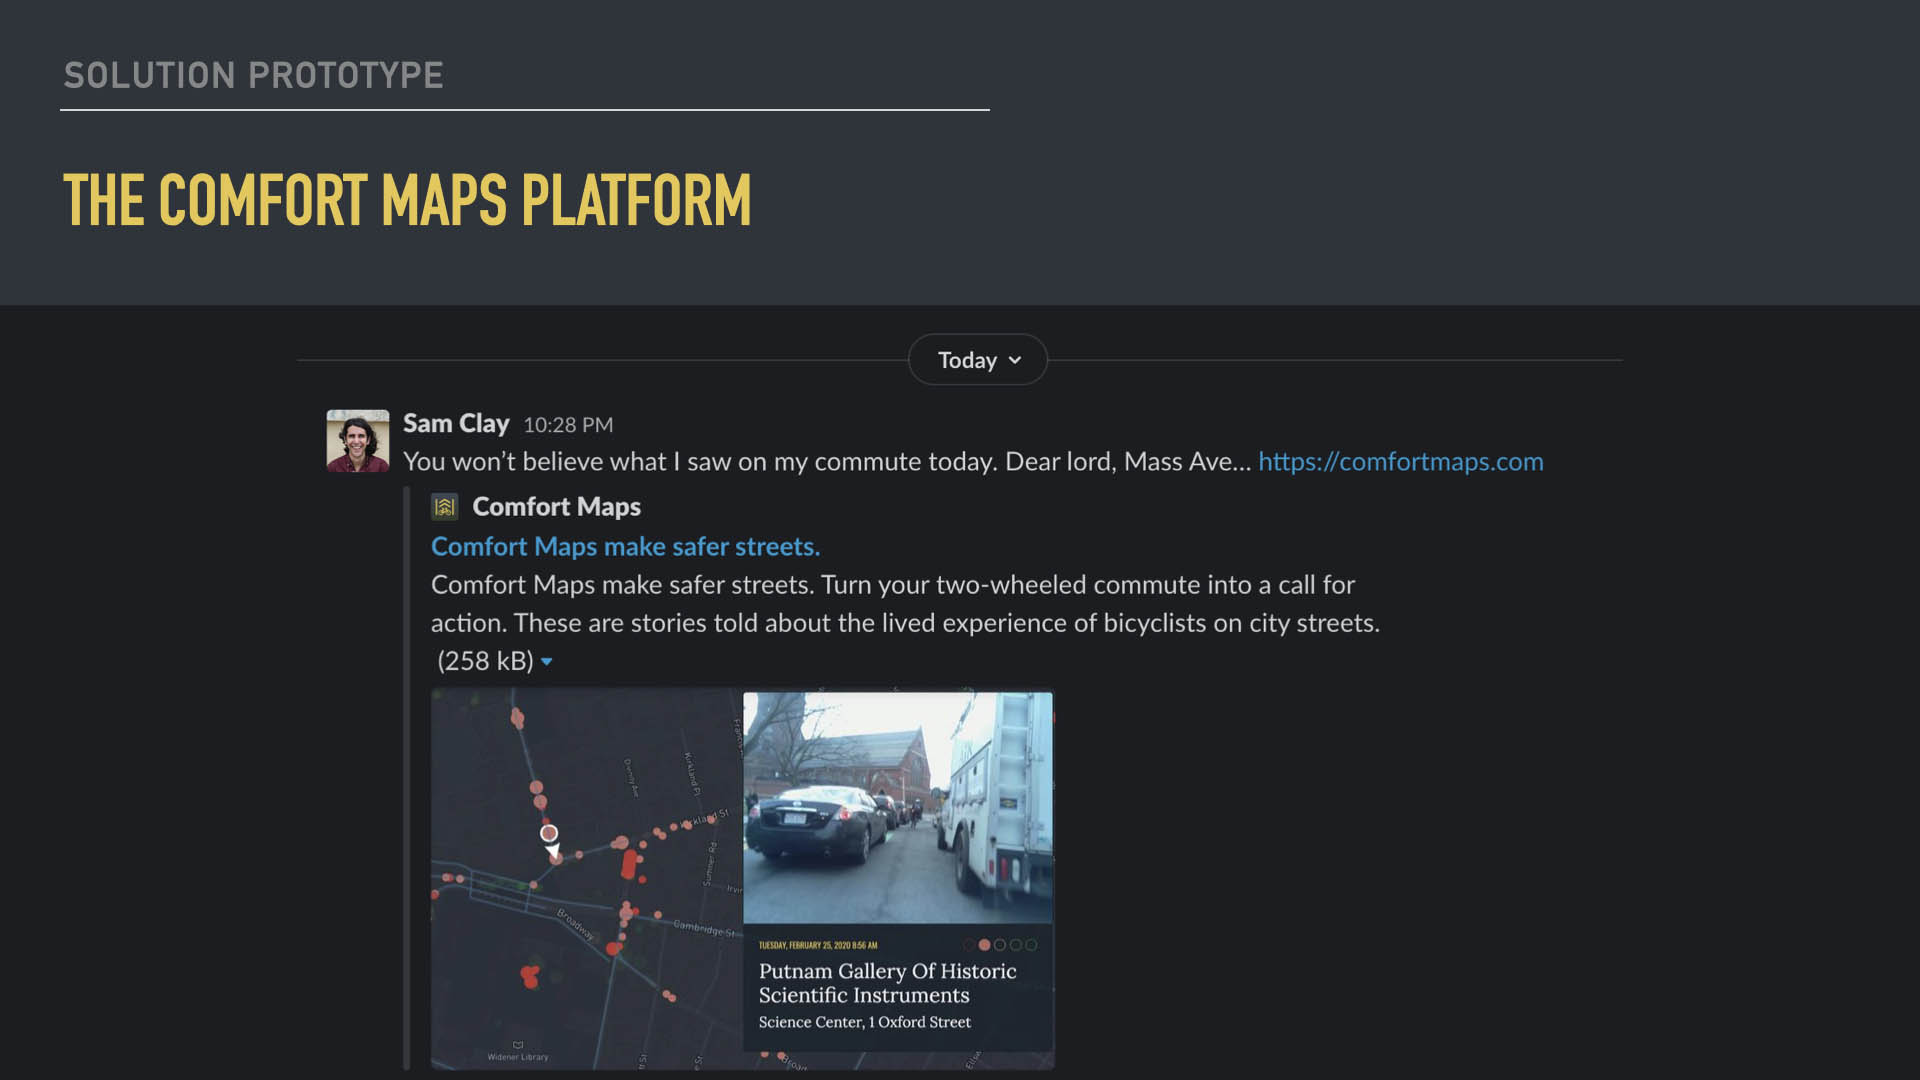
- That’s the individual side
- Now on the data visualization platform side, some of it people will come across as a tweet or a slack message, much like most news that gets shared today over social media
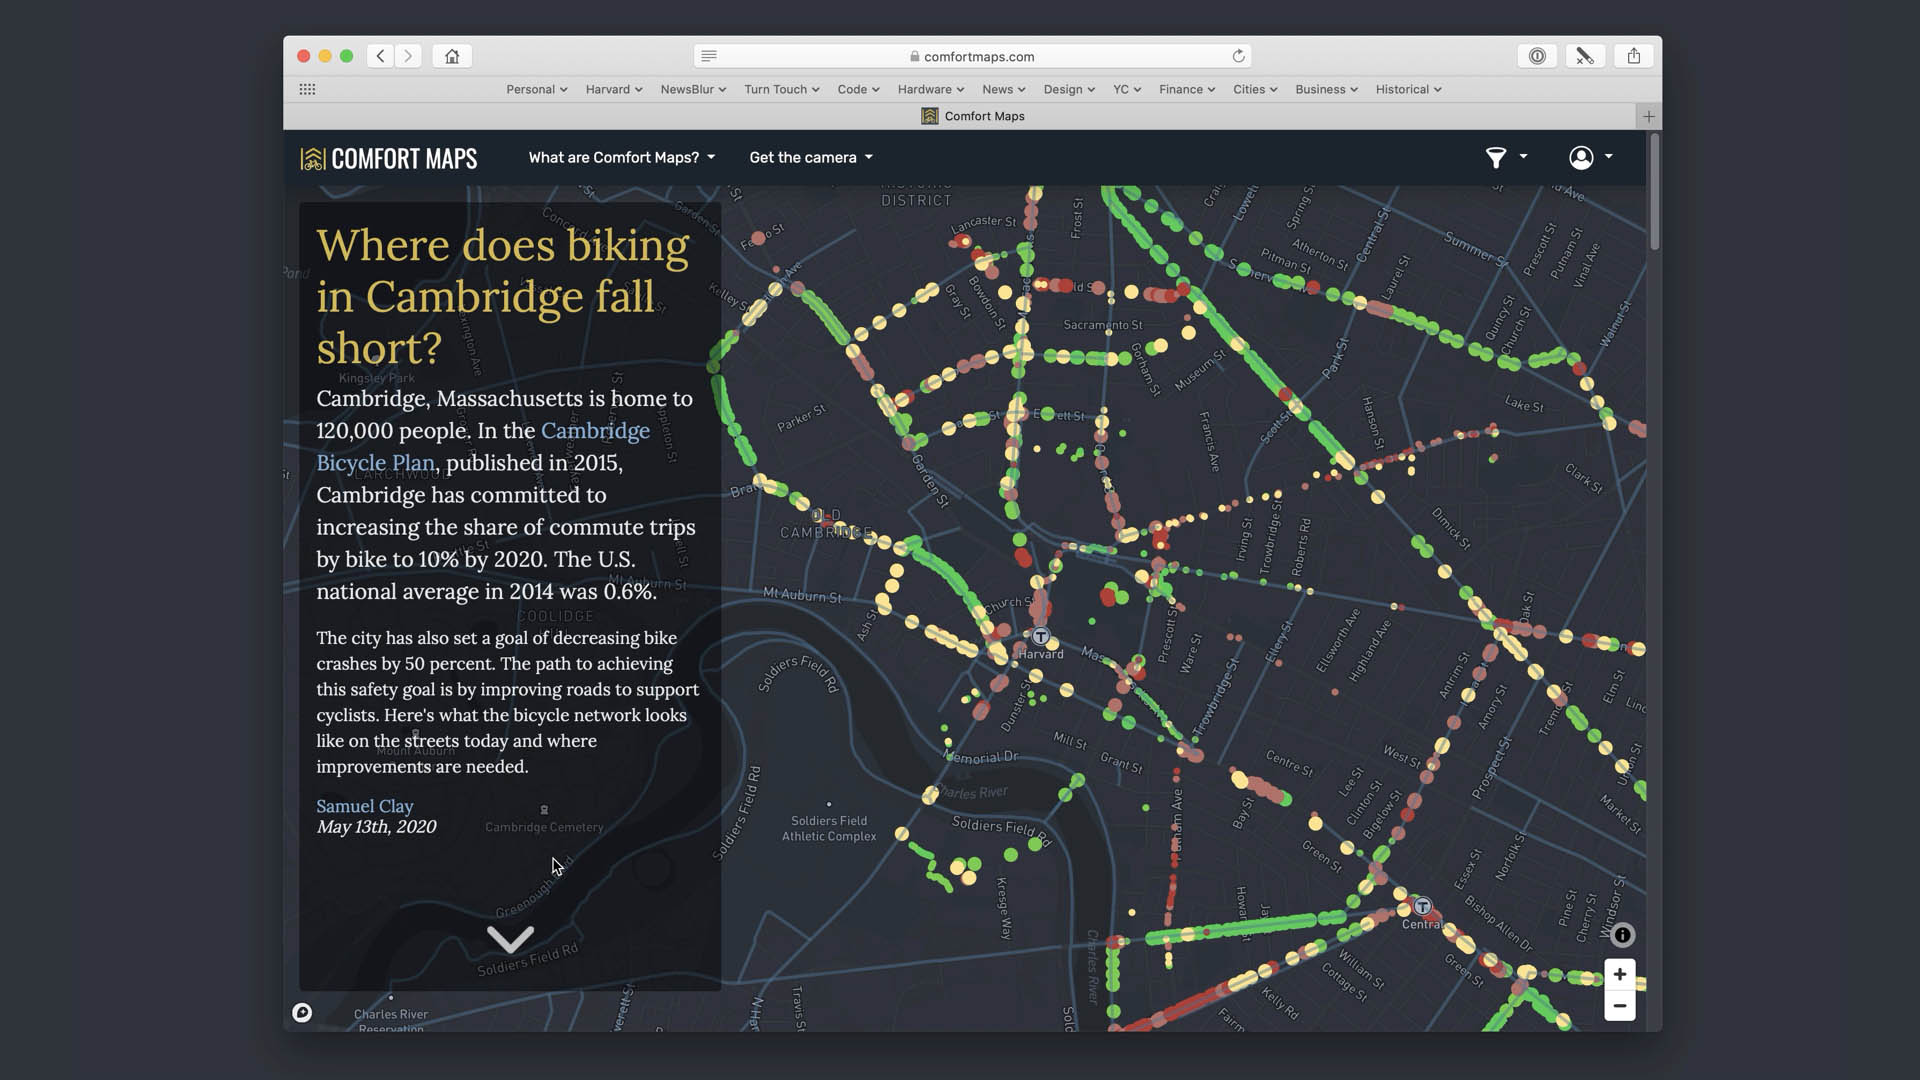

- On the web using open web standards
- Heavy on Javascript and Mapbox GL
- And it’s mobile friendly
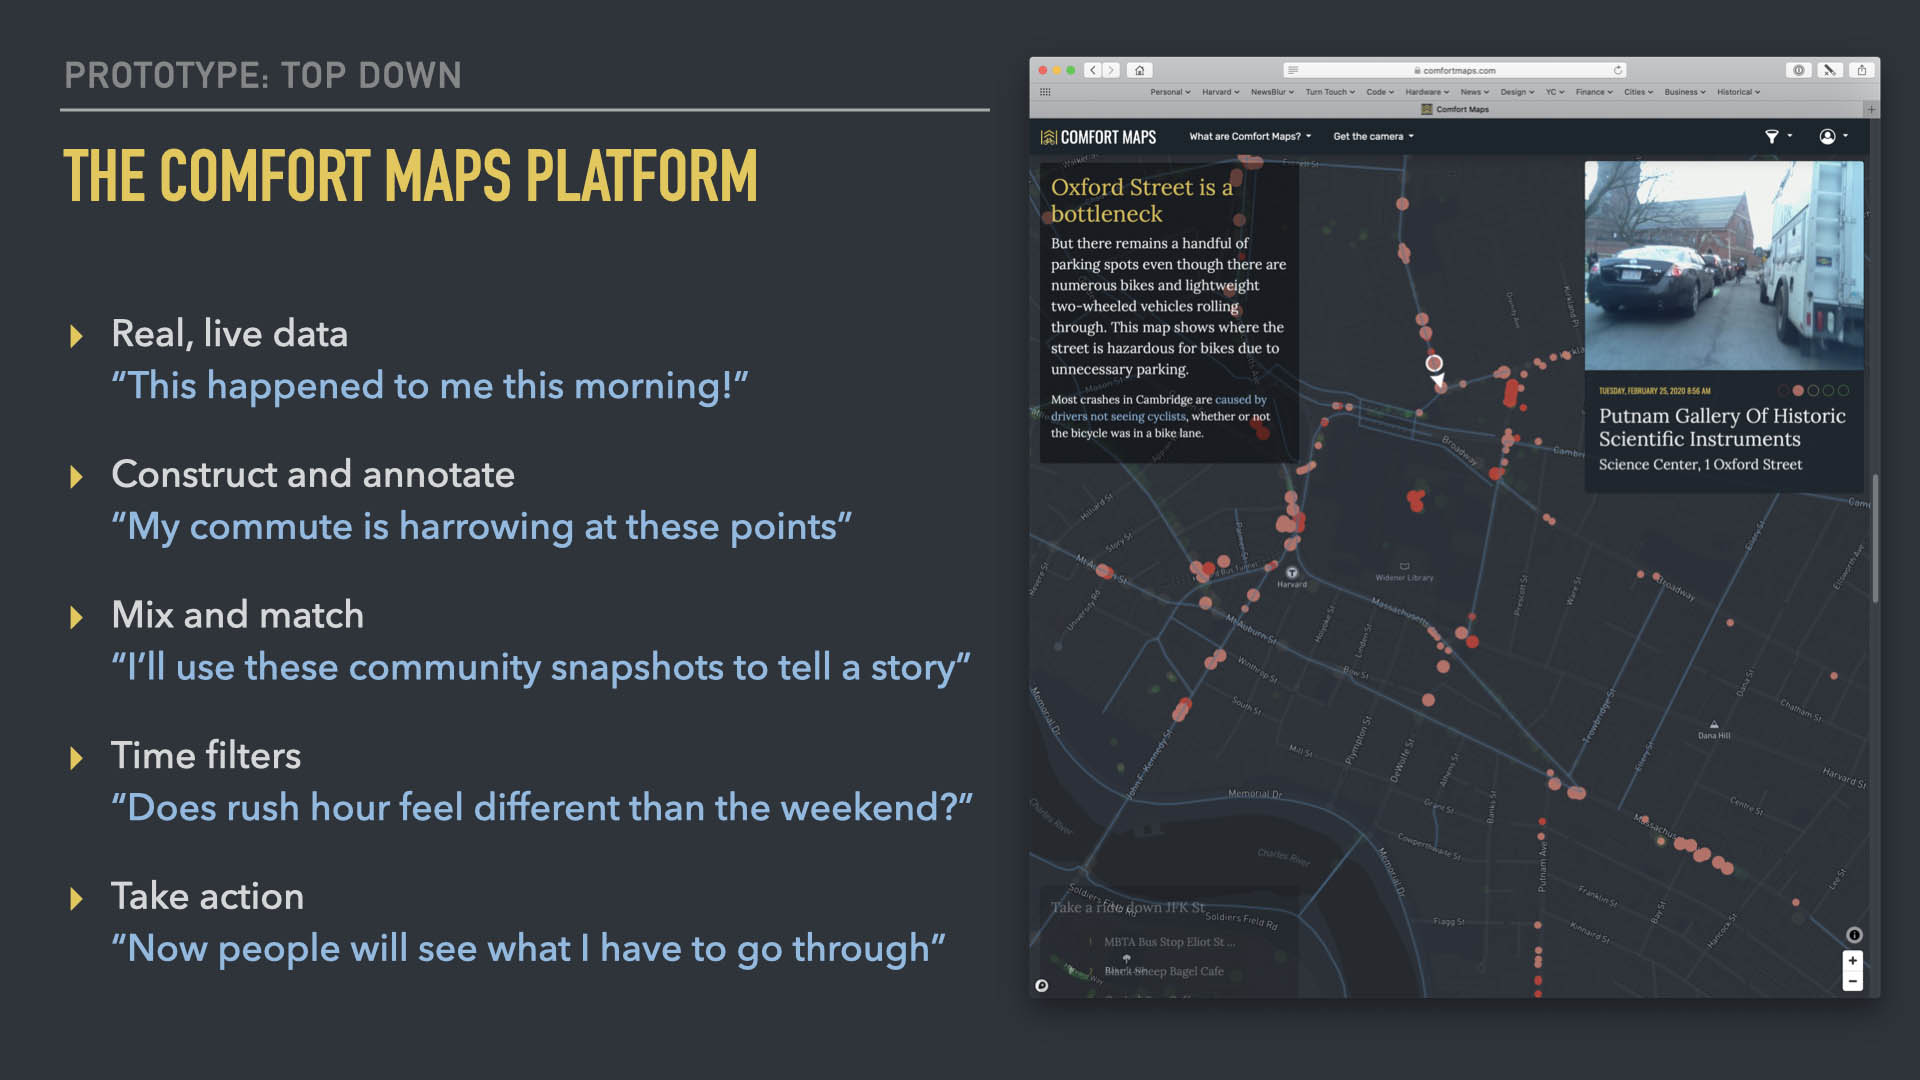
- These features are available today at comfortmaps.com
- A particular roadway may be comfortable for much of the day, but very uncomfortable during peak hours due to substantial increases in traffic.

- We have an opportunity to reset street design.
- CM is about helping municipalities make that choice.